
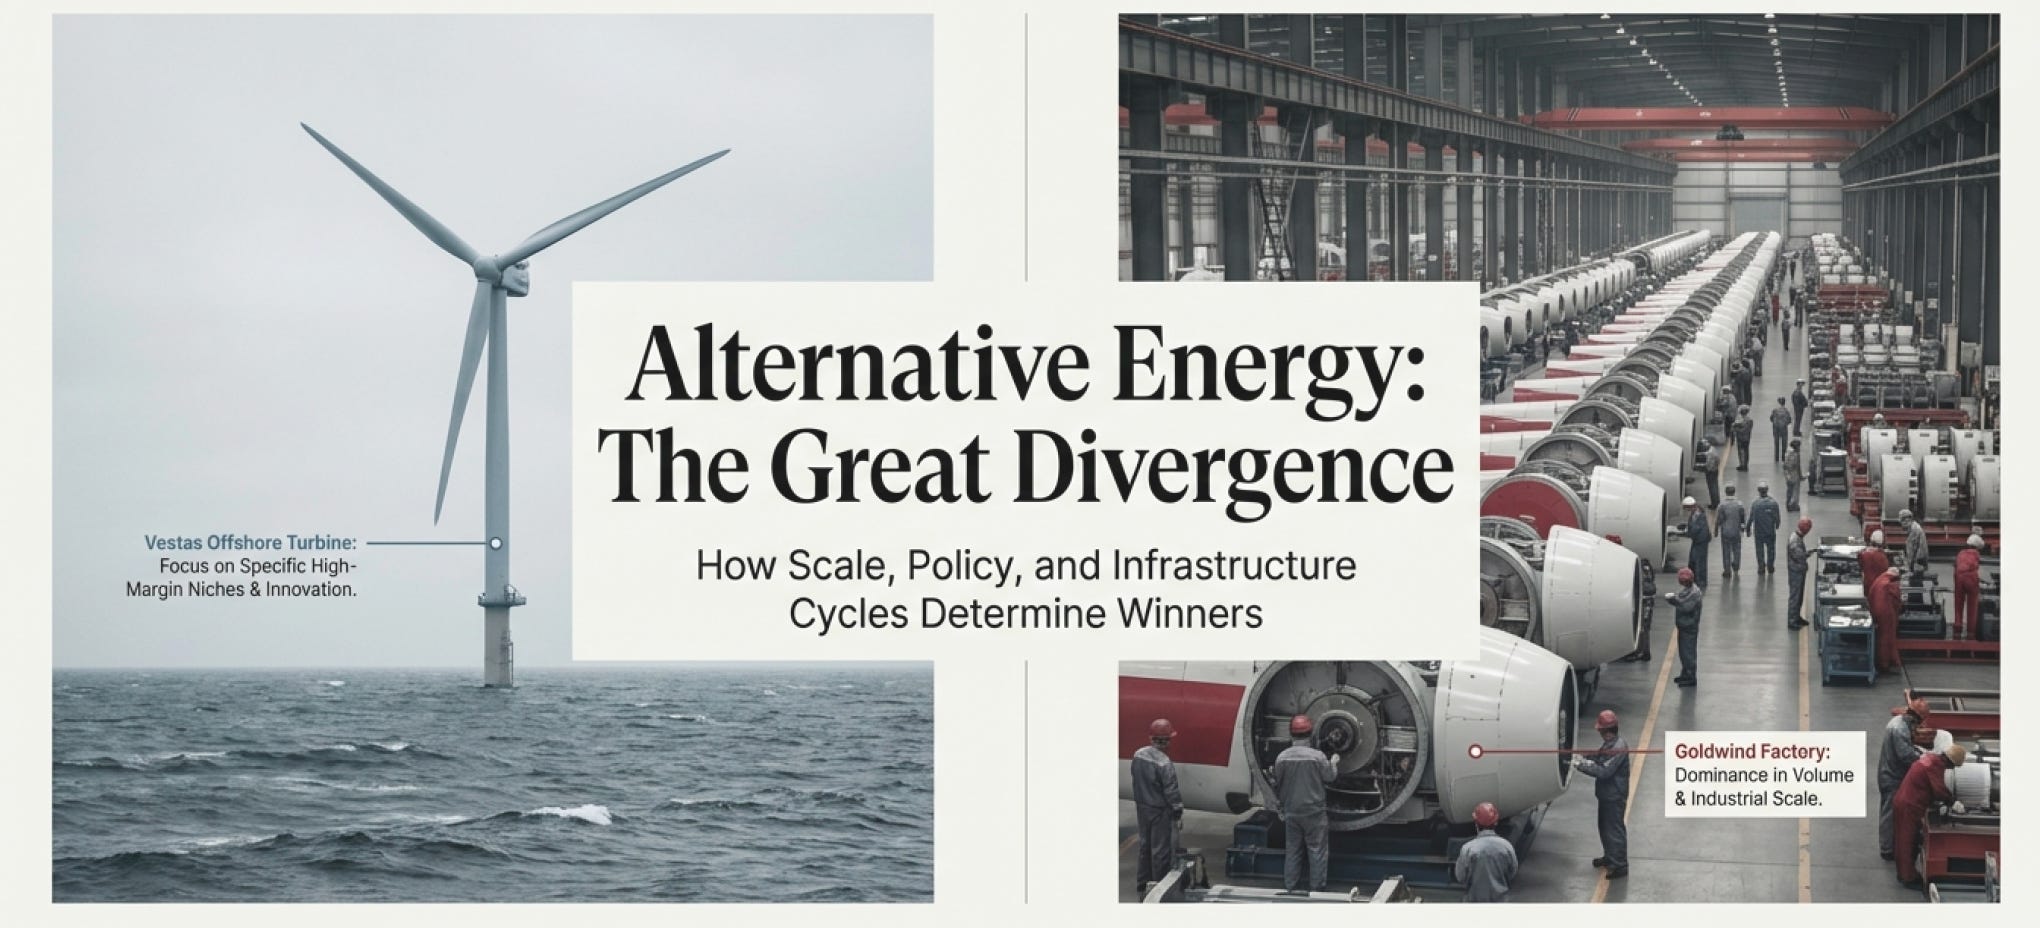
⚡️Alternative Energy Primer Part 2 - Business & Competitive Landscape
Understanding the Infrastructure That Powers Everything

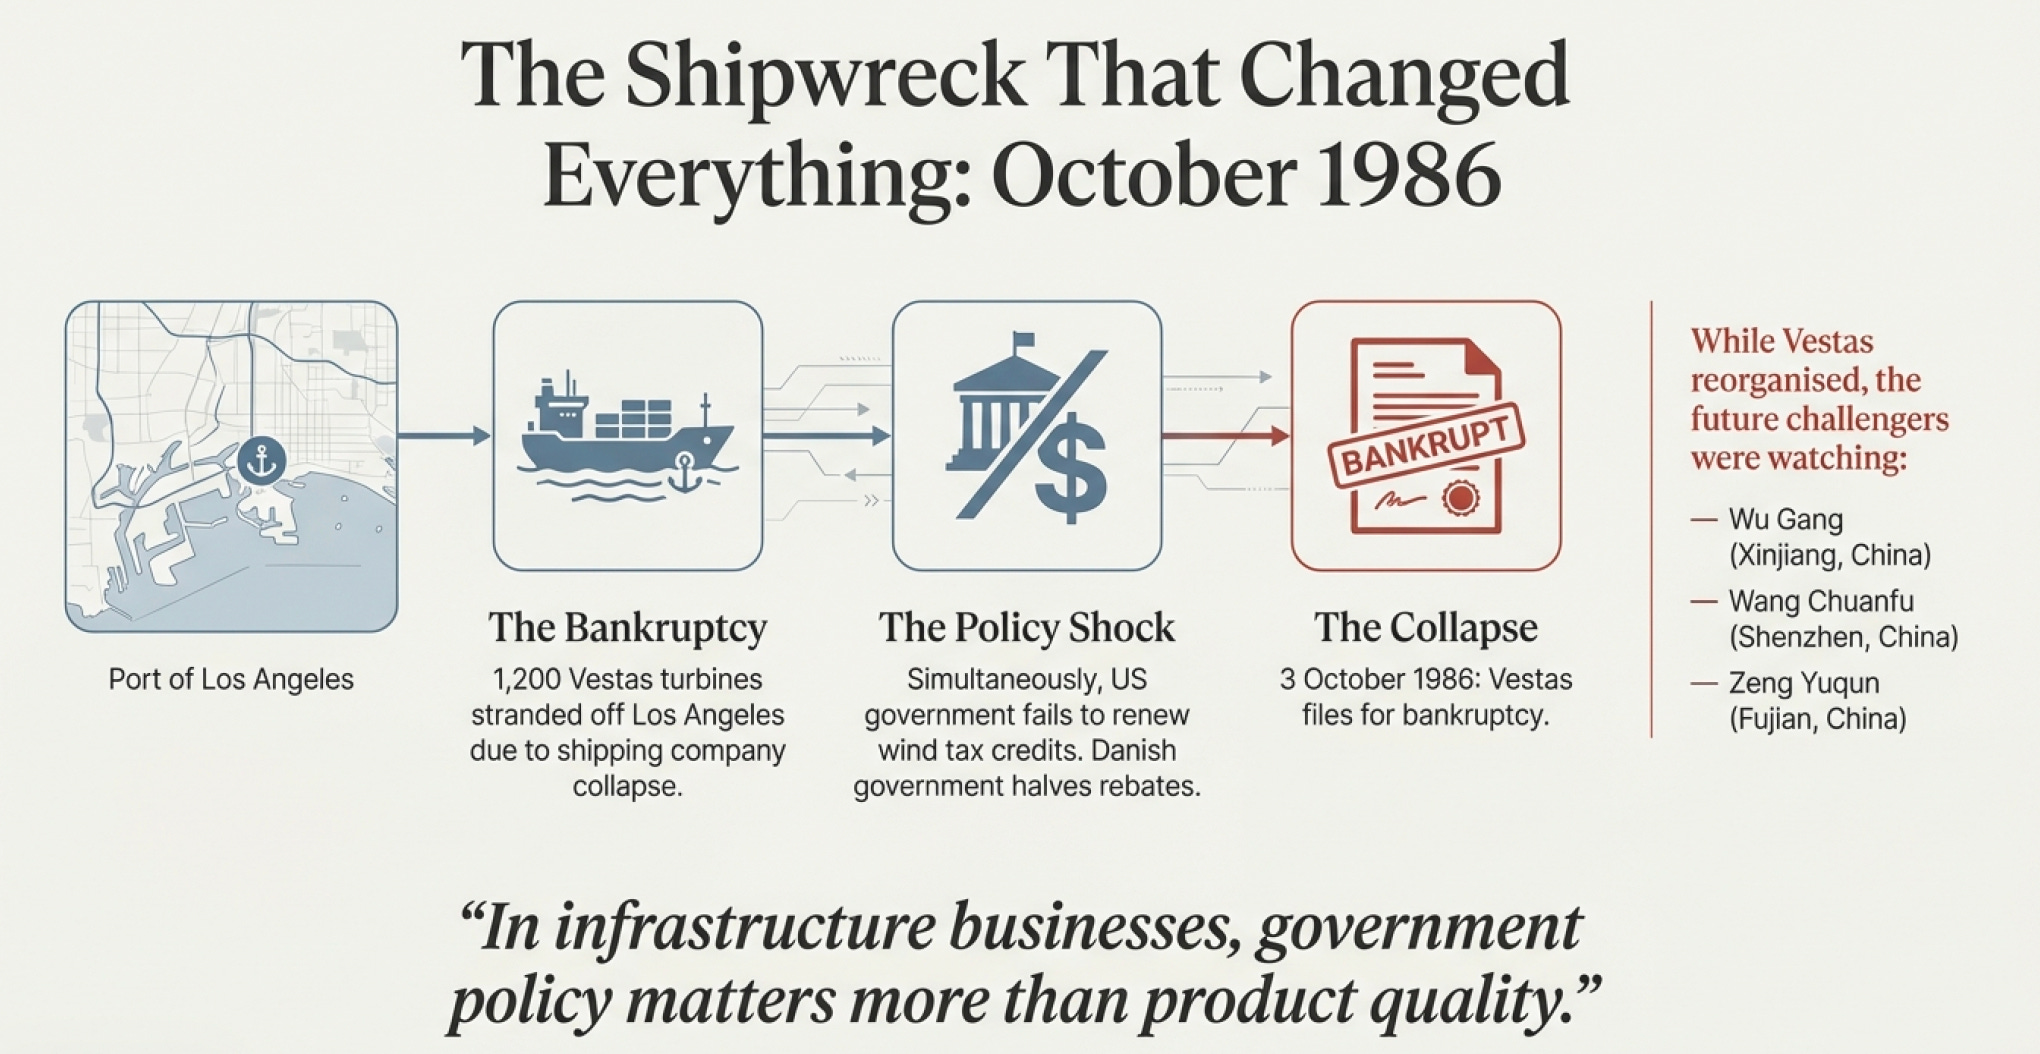
The Shipwreck That Changed Everything
October 1986, outside the Port of Los Angeles. Twelve hundred wind turbines from a Danish company called Vestas sit anchored aboard a cargo ship, ready for delivery to Zond Corporation for installation at the Sky River wind farm in California. The turbines represent the company’s largest order ever—a make-or-break contract worth millions.
Then the shipping company goes bankrupt.
The turbines sit there, anchored in international waters, while lawyers argue over who owns what. By the time the legal mess clears and the turbines finally dock, Vestas has missed its delivery deadline. Zond, now furious and cash-strapped itself, refuses to accept delivery—and can’t even pay for the turbines already installed.
Suddenly, Vestas finds itself with a warehouse full of turbines nobody wants, during the exact same month that the US government fails to renew the tax benefits that had made wind energy economically viable. To make matters worse, back home in Denmark, the government halves the rebate for turbines.
On October 3rd, 1986, Vestas—the company that had literally invented the modern three-blade wind turbine just seven years earlier—files for bankruptcy.
Now here’s the fascinating part: That bankruptcy created the conditions for everything that follows. Because while Vestas was dying in Denmark, a Communist Party member named Wu Gang was watching from Xinjiang province, China, where he’d just founded a wind turbine company called Goldwind. And 6,000 miles away in Shenzhen, a 30-year-old chemist named Wang Chuanfu was about to borrow 250,000 yuan from his cousin to start a battery company. And in a village 13 miles south of Ningde in Fujian Province, an 18-year-old named Zeng Yuqun was studying for China’s brutal college entrance exam, dreaming of escaping rural poverty.
None of these people knew each other. None of them knew they’d eventually control the majority of the world’s alternative energy infrastructure. But their stories intersect in ways that explain everything about who’s winning today and why.
This is a story about decisions—and how a single choice ripples forward through decades to reshape entire industries.
The Danish Blueprint and the Chinese Students
When Bankruptcy Teaches You What Matters
Let’s start with what Vestas got right before it collapsed.
In 1979, Birger Madsen—a provocative engineer at what was then a steel technology company making hydraulic cranes—heard about two blacksmiths in another Danish town, Karl Erik Jørgensen and Henrik Stiesdal, who’d built a three-blade wind turbine. The design was elegant: three blades arranged symmetrically, capturing wind efficiently while maintaining structural stability.
Vestas bought their design and started manufacturing. Why was this significant? Because that three-blade architecture is now in over 90% of all wind turbines worldwide. When you see a wind farm anywhere on earth today, you’re looking at descendants of those Danish blacksmiths’ design.
By 1983, Vestas turbines were prized for the same reason their agricultural equipment had been: built like Danish farming machinery—rugged, over-engineered, designed to handle rough treatment and keep working. American company Zond was buying hundreds of them for California wind farms.
But here’s the critical lesson the bankruptcy taught: in infrastructure businesses, government policy matters more than product quality.
When US tax credits disappeared and Danish rebates halved simultaneously, it didn’t matter that Vestas had the best turbines. Nobody could afford to buy them. The company employed 870 people in 1985. By October 1986, it was bankrupt.
The reorganization in 1987 created Vestas Wind Systems A/S—a pure-play wind turbine company with just 60 employees led by new CEO Johannes Poulsen. Most of the old Vestas group was sold off. This was the phoenix moment: focusing exclusively on wind, stripped of everything else.
And here’s what makes this story interesting: Vestas’s near-death experience taught watching competitors exactly what mattered. If the Danish pioneers could be destroyed by legislative changes despite having superior technology, then the real competitive advantage wasn’t engineering excellence—it was being in a market large enough and stable enough to survive policy volatility.
Enter China.
The First Teacher: Denmark Funds China’s Wind Education
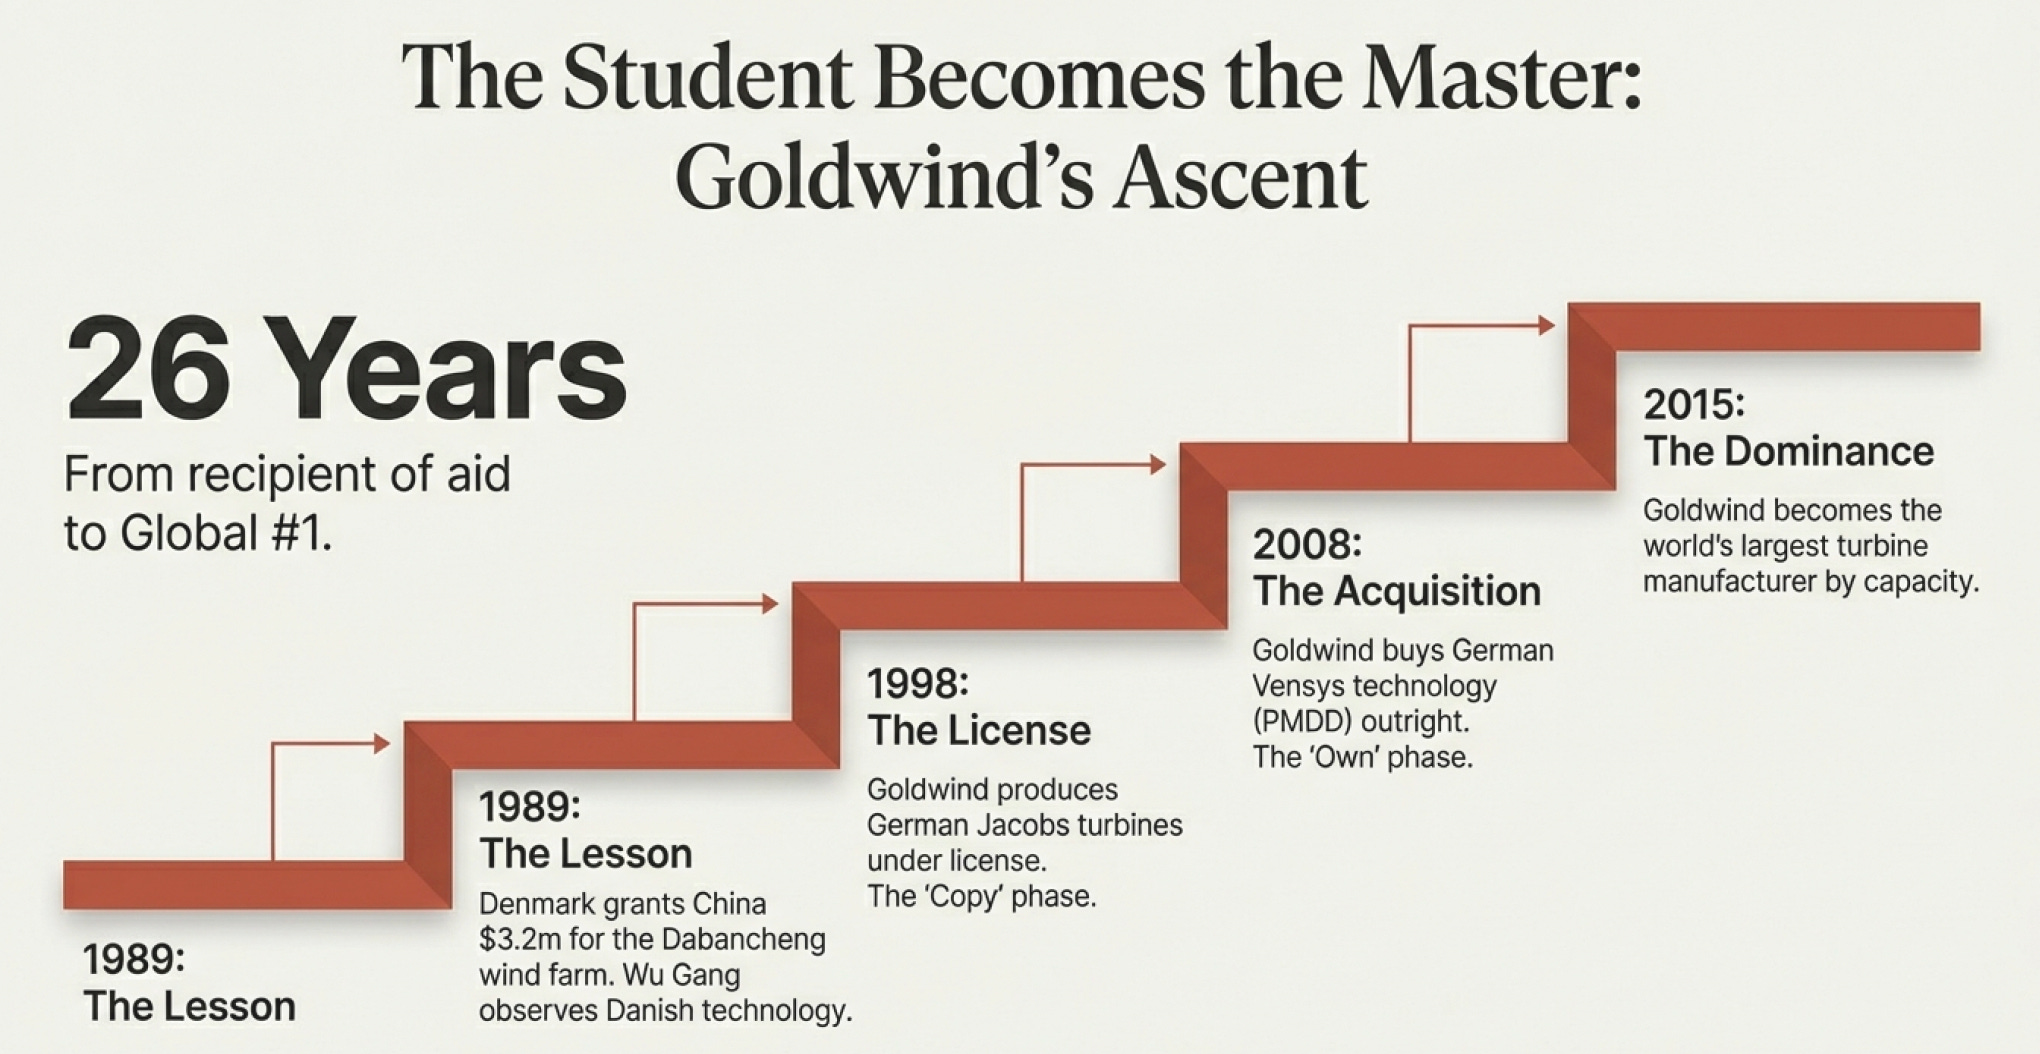
In 1989—just two years after Vestas’s bankruptcy and reorganization—something remarkably generous (or remarkably short-sighted, depending on your perspective) happened.
The Danish government gave China a $3.2 million grant to build the country’s first wind farm at Dabancheng in Xinjiang province. They installed thirteen small turbines, 150 kilowatts each, all manufactured by Danish company Bonus Energy.
Wu Gang, who’d founded Goldwind that same year as part of China’s 863 High-Tech Development Program, was paying close attention. China’s strategy was explicit: learn from the West, build domestic capabilities, eventually dominate.
Goldwind became very good students. In 1998, they began producing German-designed Jacobs turbines under license from aerodyn Energiesysteme. They didn’t innovate—they manufactured designs created by others, learned the engineering principles, built supply chain relationships, trained workers.
Standard industrial development playbook: copy, improve, scale.
Then in 2008—here’s the inflection point—Goldwind signed a technology transfer agreement with German manufacturer Vensys for permanent magnet direct-drive (PMDD) technology. This wasn’t a license. They bought it outright. Permanently.
PMDD was a genuine breakthrough: no gearbox, fewer moving parts, lower maintenance, higher efficiency. Just one main bearing and direct connection from blades to generator. The kind of technology that changes unit economics permanently.
Remember the timeline:
1979: Vestas pioneers three-blade turbine design
1986: Vestas goes bankrupt due to policy changes
1989: Denmark funds China’s first wind farm
2008: Goldwind acquires cutting-edge German technology
2015: Goldwind becomes world’s largest wind turbine manufacturer
From “grateful recipients of Danish aid” to “buyers of cutting-edge German technology” to “global market leader” in 26 years.
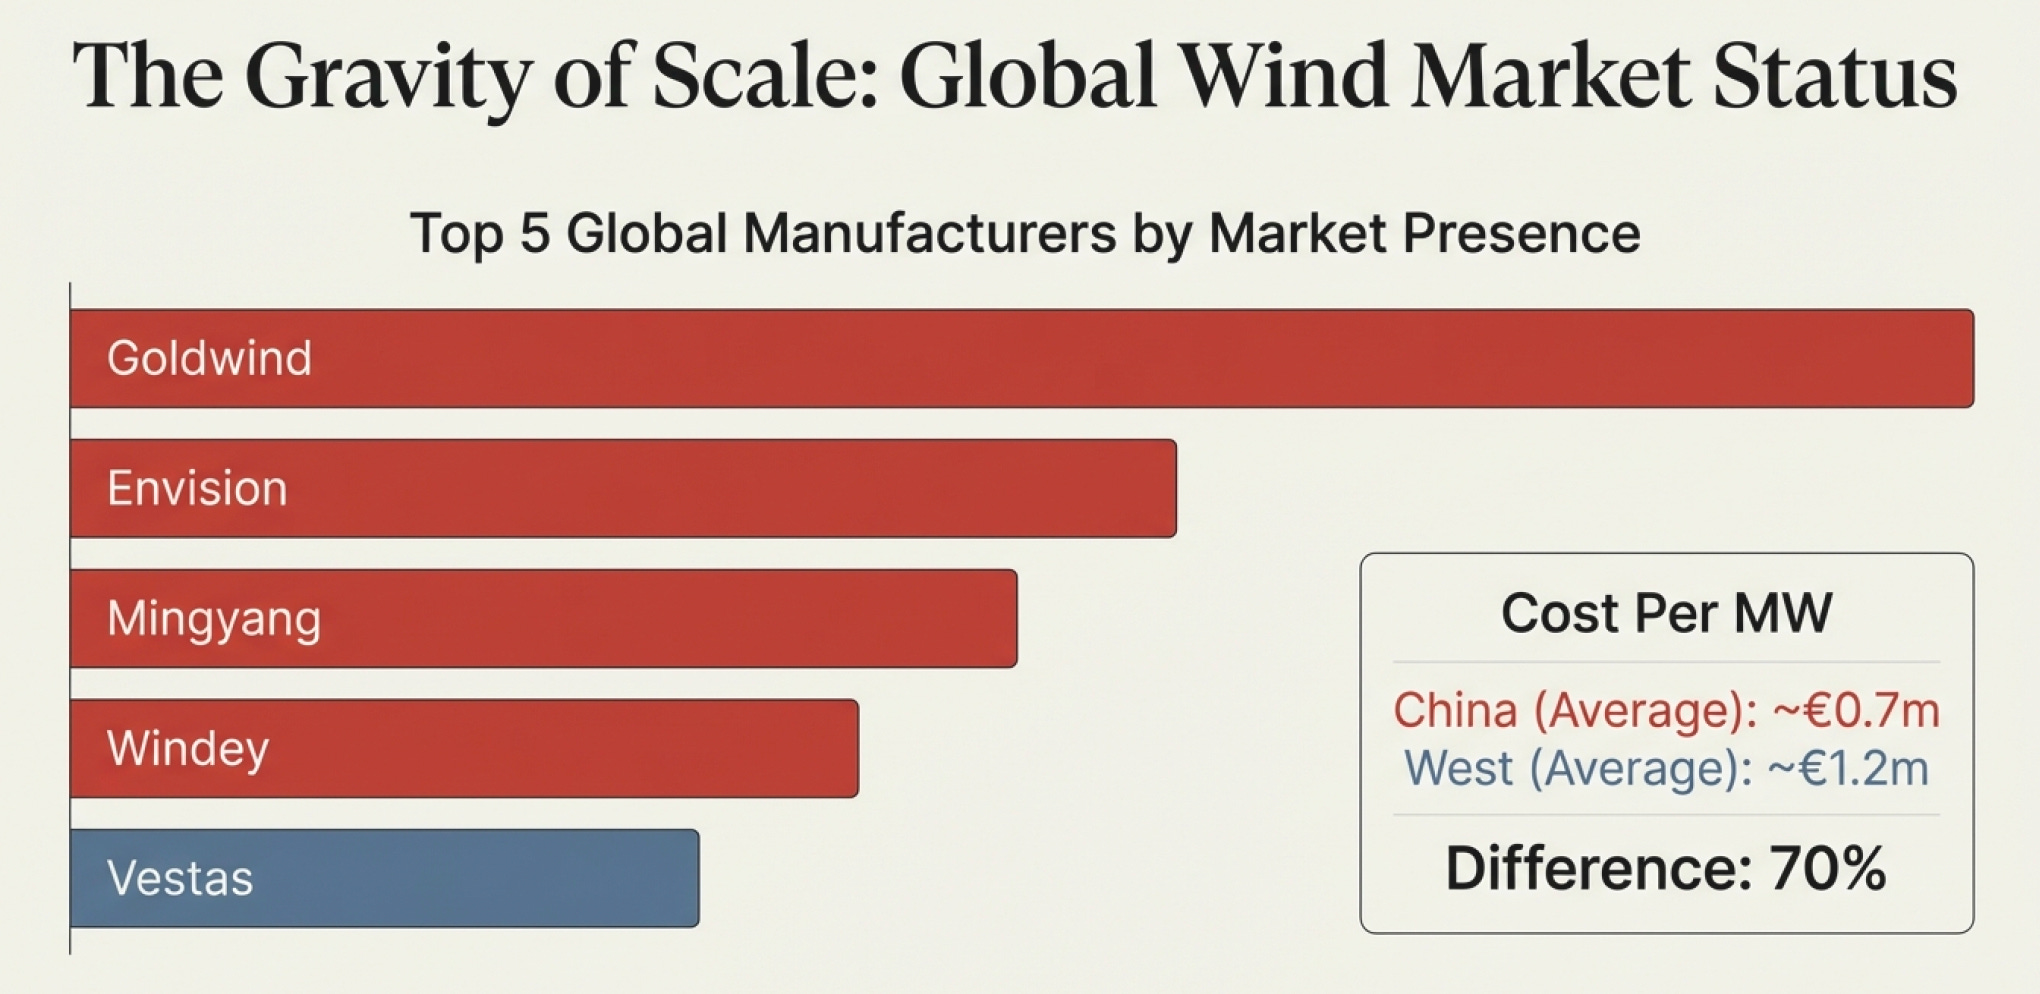
By 2024, the rankings told a stark story:
Goldwind (China): 20+ GW installed globally, 23% of China’s domestic market
Envision (China): Second place globally
Mingyang (China): Third place globally
Windey (China): Fourth place globally
Vestas (Denmark): 10.2 GW installed outside China, fallen two positions from its historic dominance
The top four were all Chinese. For the first time in wind turbine history.
But—and this is where it gets interesting—Vestas still dominated Europe with 92% market share (up from 88% in 2023). Siemens Gamesa led in offshore wind outside China. GE Vernova controlled massive share in the US onshore market.
So what’s happening here? How can Goldwind be #1 globally while Vestas maintains near-monopoly in Europe?
The answer is scale creating its own gravity. When you’re manufacturing 3x what everyone else combined produces, several things happen automatically:
Your per-unit costs collapse. Goldwind turbines cost roughly €0.65-0.75 million per MW. Vestas charges €1.2 million per MW. That’s a 70% cost difference.
Your supply chain optimizes around you. When Chinese manufacturers dominate volume, suppliers invest in serving them, not Western manufacturers. Polysilicon producers, steel manufacturers, rare earth processors—they all build capacity around Chinese demand.
Your engineers accumulate unmatched experience. When China installed 127 GW of wind in 2024 versus 40 GW for the entire rest of the world combined, Chinese engineers see 3x more failure modes, edge cases, and optimization opportunities than Western engineers.
This is Munger’s “lollapalooza effect”—multiple factors reinforcing each other to create overwhelming advantage. But it only works because China provided something Vestas never had: a domestic market so massive that policy volatility in any single foreign market doesn’t kill you.
Vestas nearly died when US policy changed. Goldwind could lose every international market and still thrive selling to China alone.
That’s not a technical advantage. That’s a structural advantage that no amount of engineering can overcome.
The Meeting That Created a $179 Billion Company
Now let’s talk about batteries, because this is where a single conversation changed everything
Two Orphans, Two Paths
In February 1995, a 29-year-old Chinese chemist named Wang Chuanfu borrowed 250,000 yuan from his cousin and founded a battery company in Shenzhen called BYD (”Build Your Dreams”).
Wang had grown up in brutal poverty in Anhui province—one of eight children in a farming family. Both parents died when he was young. His older brother dropped out of school at 18 to work, using his meager wages to keep Wang in school because he understood education was the only way out.
Wang earned a master’s in metallurgical physical chemistry, worked briefly at a state battery company, and saw an opportunity: Japanese manufacturers were transitioning from nickel-cadmium to lithium-ion batteries for mobile phones. That transition created a gap—someone needed to supply the old technology while it was still being phased out.
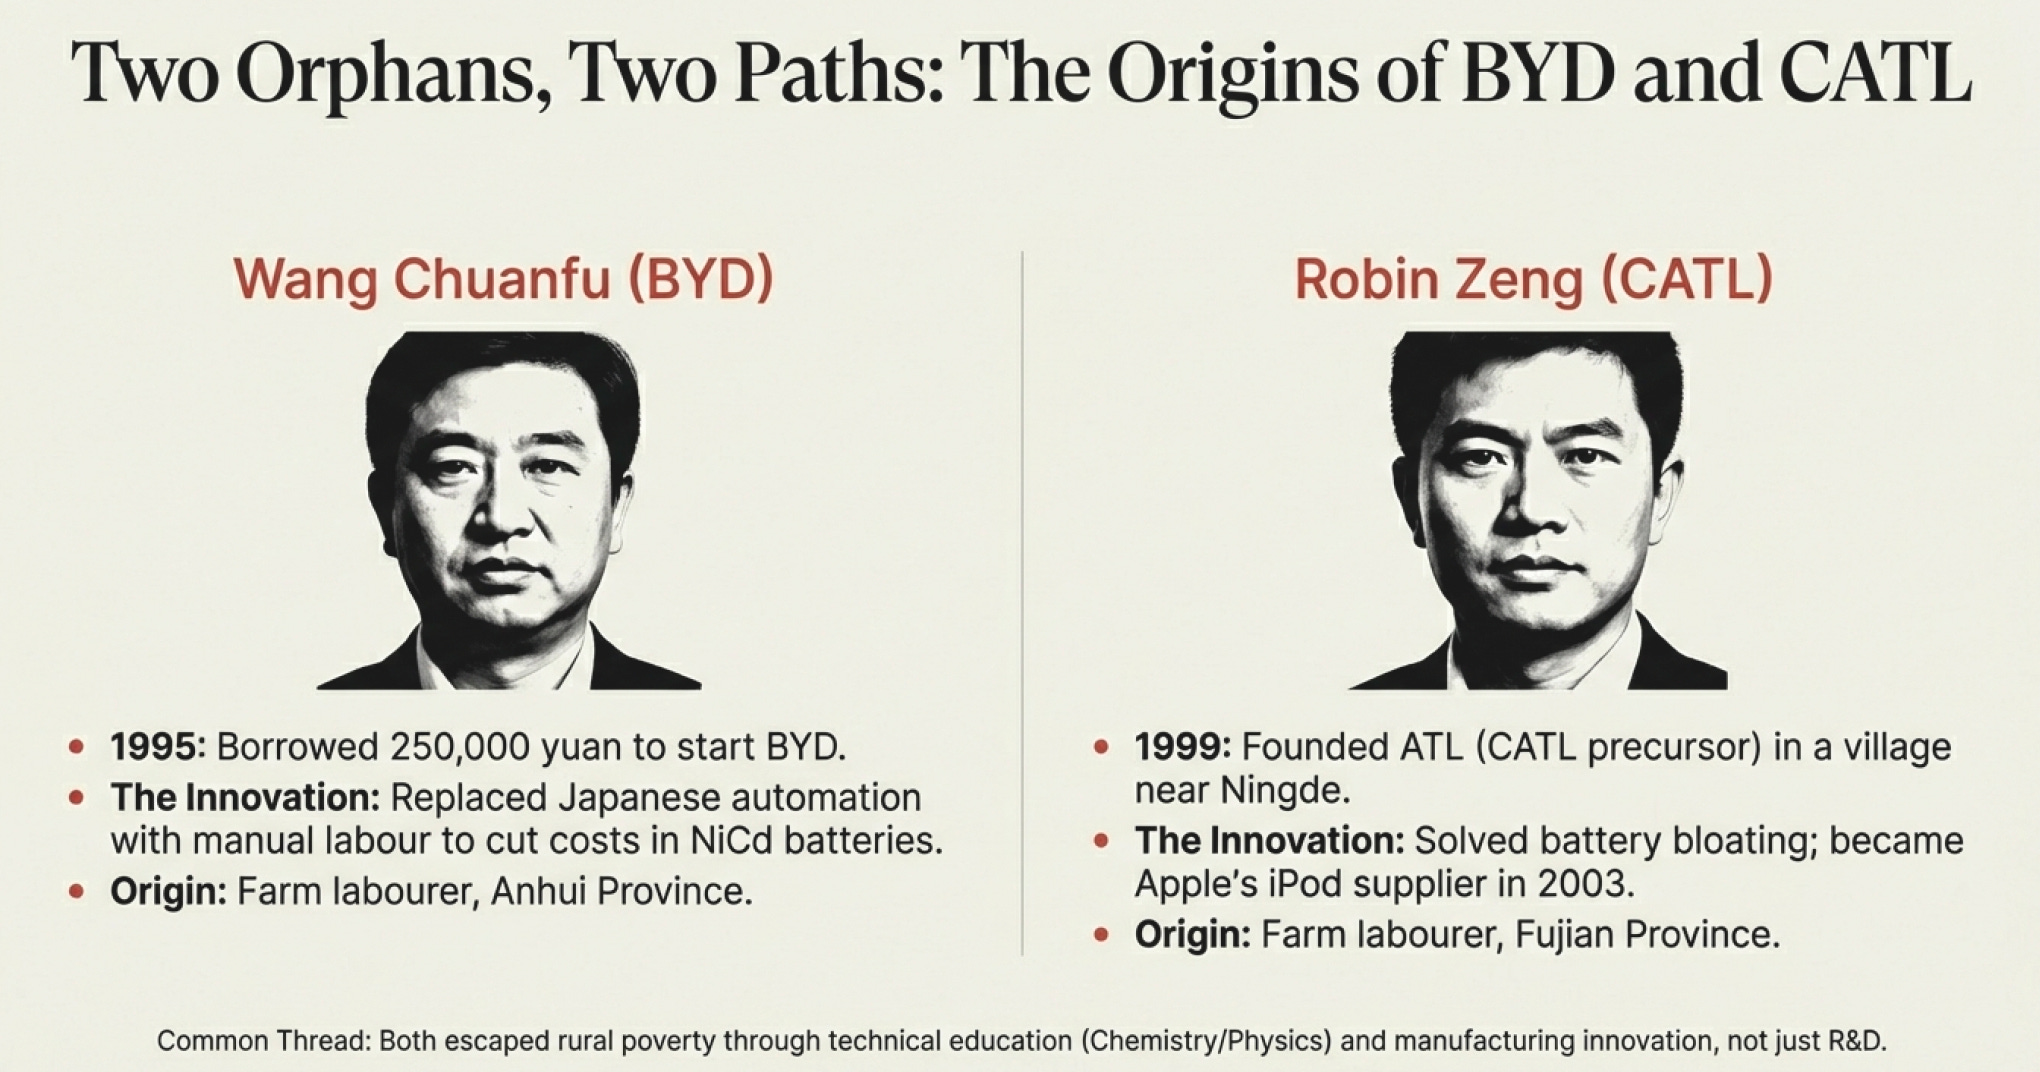
Wang’s innovation wasn’t technical—it was manufacturing. Instead of capital-intensive automated processes like Japan used, BYD redesigned production to incorporate more manual labor, drastically cutting costs. By 2002, BYD was the world’s largest manufacturer of nickel-cadmium batteries, surpassing Sanyo.
Meanwhile, 1,300 miles northeast in a village near Ningde, Fujian Province, another man from rural poverty was following a similar path.
Zeng Yuqun—known as Robin Zeng—was born in 1968 to a farming family. Like Wang, he aced China’s college entrance exam and escaped through education, earning a PhD in condensed matter physics. He worked at a state shipbuilding company, then joined an electronics factory.
In 1999, Zeng and two colleagues founded ATL (Amperex Technology Limited) to make lithium polymer batteries for portable electronics. They bought a US patent for mobile phone batteries, and Zeng—being Zeng—personally worked to improve the design. His breakthrough came when he solved the battery bloating problem plaguing early lithium polymer batteries.
In 2003, Apple chose ATL to supply batteries for the newly launched iPod.
Think about that timing: BYD became the world’s largest NiCd battery maker in 2002. ATL became Apple’s iPod battery supplier in 2003. Both companies—led by men from rural Chinese poverty who escaped through technical education—were now dominant in consumer electronics batteries.
But cars weren’t on either company’s radar yet. That required a problem that didn’t exist in China—and a German executive desperate enough to fly to a remote Chinese city looking for solutions.
The Problem BMW Couldn’t Solve
By 2010, BMW had a dilemma. They wanted to build electric vehicles, but European and Japanese battery manufacturers couldn’t deliver the combination of cost, capacity, and energy density BMW needed.
Herbert Diess, then head of purchasing for BMW, had approached everyone: Bosch in Germany, Samsung in Korea, Panasonic in Japan. Some weren’t interested. Some quoted prices that made electric cars economically impossible. Bosch even agreed initially, then backed out in September 2011, leaving BMW’s joint venture project in China without batteries.
In desperation, Diess flew to Ningde to visit a laptop battery company he’d heard about called ATL.
The meeting between Herbert Diess and Zeng Yuqun in 2010 is one of the great pivot points in industrial history.
Diess asked if ATL could make batteries for electric vehicles. Zeng was skeptical—dismissive, actually. EV batteries required completely different engineering than consumer electronics: higher energy density, much longer lifespan, ability to withstand thousands of charge cycles, thermal management at scale, safety systems to prevent catastrophic failures.
But Diess pushed. And here’s where one decision changed everything.
In 2011, Zeng and several Chinese investors acquired 85% of TDK’s (ATL’s Japanese owner) EV battery division and spun it off into a new company: Contemporary Amperex Technology Limited (CATL), headquartered in Ningde.
BMW became the first major customer in 2012. But here’s what’s remarkable and often overlooked: Zeng personally read all 800 pages of BMW’s battery requirements. Line by line.
Not his engineering team. Not his procurement department. Zeng himself, the CEO, reading dense technical specifications about charge cycles, thermal runaway prevention, vibration resistance, cold-weather performance. Because he understood that infrastructure businesses aren’t won by people who think they know—they’re won by people who know they need to understand everything.
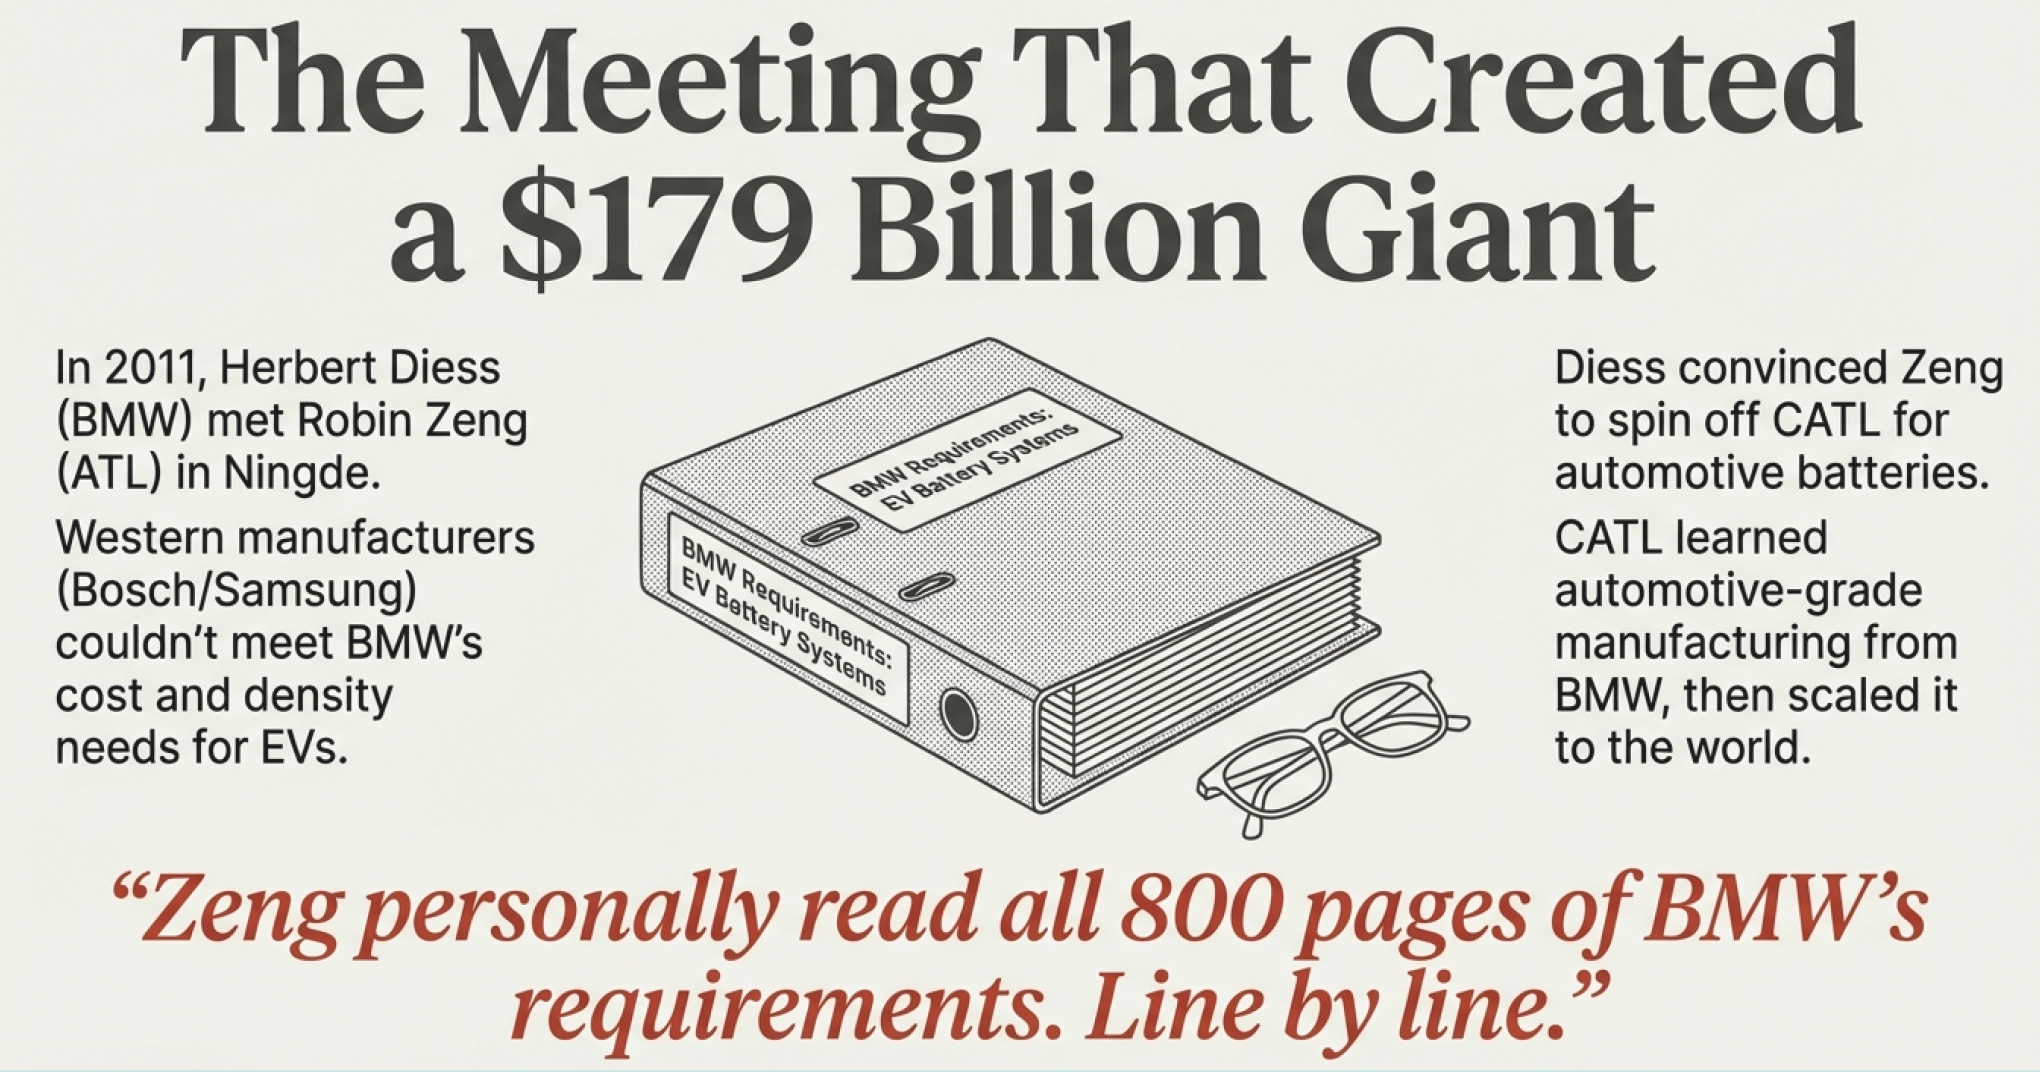
By 2017, CATL became the world’s largest battery manufacturer, surpassing Panasonic and BYD.
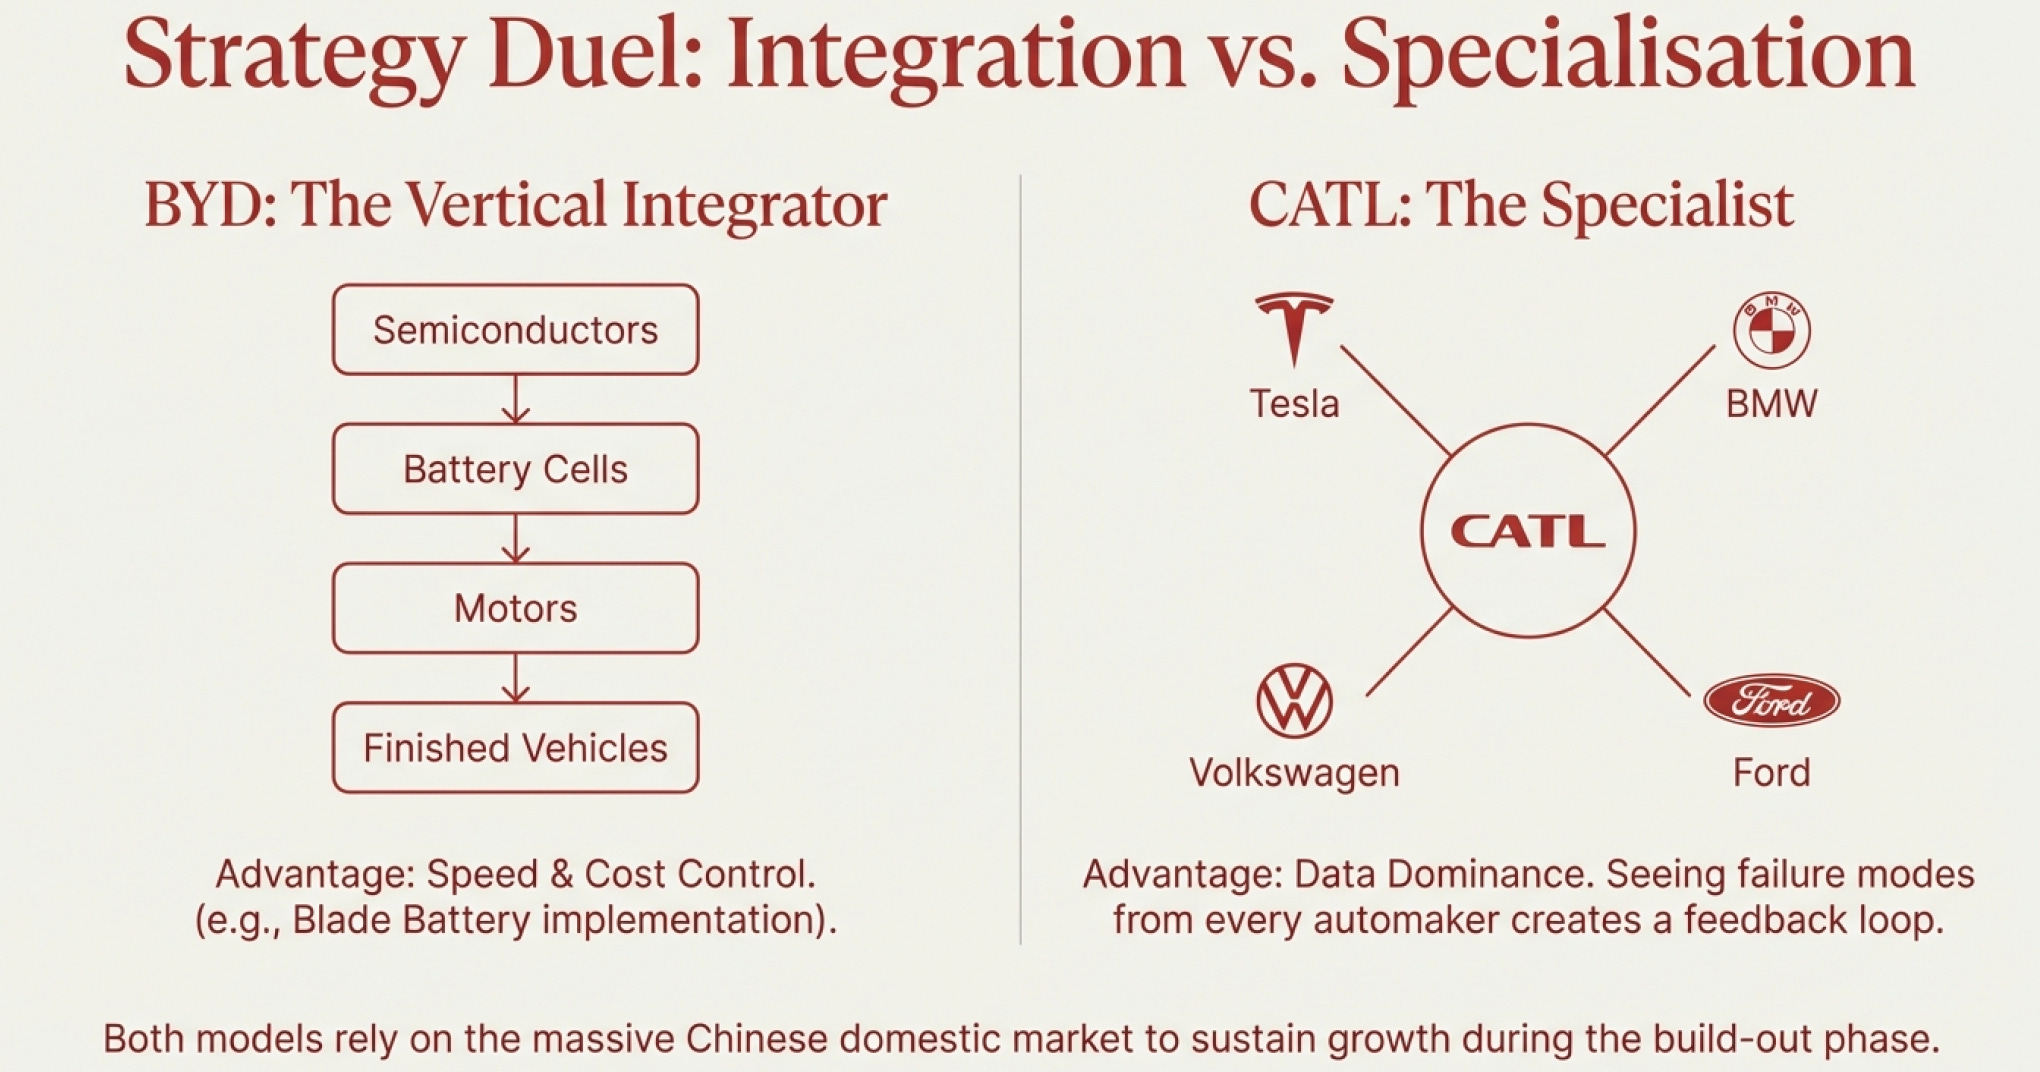
Here’s where the two orphans’ paths diverged in fascinating ways:
Wang Chuanfu at BYD chose vertical integration. Make everything—battery cells, battery management systems, electric motors, power electronics, the entire vehicle. When BYD developed their revolutionary Blade Battery technology in 2020 (LFP cells in a structural pack), they controlled the full implementation stack. No negotiating with external customers. Development cycles measured in months, not years.
Zeng Yuqun at CATL chose specialization. Make the best batteries in the world and supply everyone. Get data from Tesla, BMW, Volkswagen, Toyota—every different use case, climate, driving pattern. See more failure modes than any vertically integrated player possibly could, then use that learning to make better batteries for everyone.
Both strategies worked spectacularly. But they created fundamentally different competitive dynamics.
The Numbers Today: Two Models, One Dominant Trend
BYD’s position (2024-2025):
Delivered 2.6 million new energy vehicles (Jan-Aug 2025), 19.9% global market share
Ranks second worldwide behind fellow Chinese manufacturer Geely (1.3 million, 68% YoY growth)
Tesla fell to third with 985,000 deliveries (7.7% share), down 11% annually
The top five Chinese automakers control 43% of the global EV market
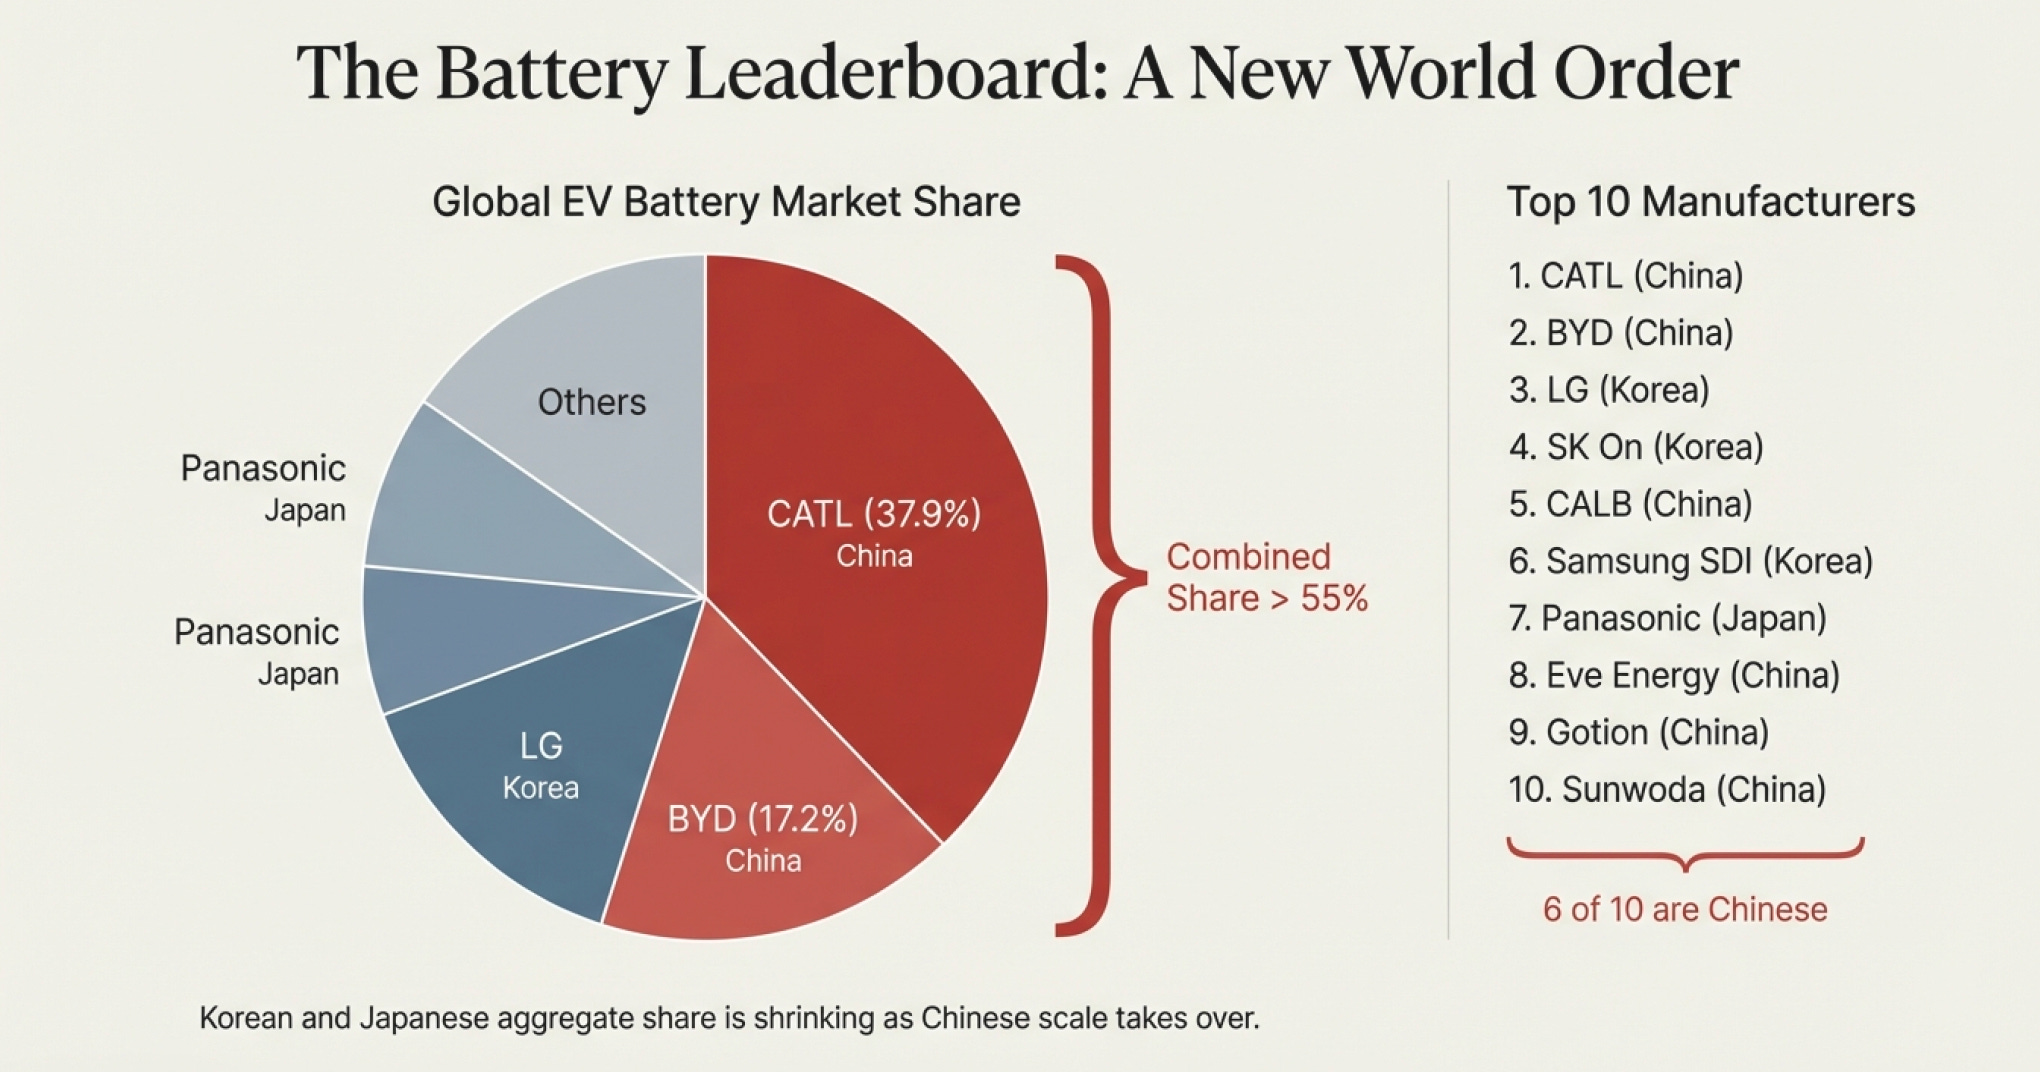
BYD makes batteries, motors, semiconductors, and is the world’s #2 battery manufacturer with 17.2% share (153.7 GWh)
CATL’s position (2024):
339.3 GWh of batteries produced, commanding 37.9% of the global EV battery market
Supplies Tesla, Toyota, Ford, BMW, Mercedes-Benz, Volkswagen—virtually every major automaker
One in three electric vehicles globally runs on CATL batteries
Market cap: $179 billion—larger than Ford and GM combined
Zeng Yuqun’s net worth: $57.5 billion (29th wealthiest person globally)
Add them together: CATL and BYD control 55.1% of the global EV battery market. Two Chinese companies founded by former orphans who escaped poverty through physics education now control majority share of the technology everyone needs for the energy transition.
The next tier tells you everything else you need to know:
3. LG Energy Solution (South Korea): 96.3 GWh, ~11% share
4. SK On (South Korea): ~4.7% share
5. CALB (China): ~4.7% share
6. Samsung SDI (South Korea): ~4.3% share
7. Panasonic (Japan): ~4.3% share
8. Eve Energy (China): ~2.6% share
9. Gotion High-Tech (China): ~2.2% share
10. Sunwoda (China): ~2.0% share
Six of the top ten are Chinese. The Korean and Japanese companies aren’t disappearing—but their aggregate share is slowly declining as Chinese manufacturers capture the growth.
Now here’s the question every investor should ask: Why did two fundamentally different business models (BYD’s vertical integration vs. CATL’s specialization) both achieve market dominance—and why are both Chinese?
Because both models require something Western companies don’t have: a domestic market so massive it provides baseline demand regardless of international market conditions, and government support that sustains losses during the build-out phase longer than Western shareholders will tolerate - as Alex Hormozi says “Entrepreneurship isn’t a game of best man wins. But last man standing".
The Pattern That Repeats: Learn, Scale, Dominate
Look at how every successful Chinese manufacturer followed the identical playbook:
Step 1: Learn from the West (1980s-2000s)
Goldwind used Danish grants and German licenses
BYD analyzed Sony and Sanyo batteries
CATL started as TDK’s subsidiary making iPod batteries
Step 2: Achieve manufacturing excellence (2000s-2010s)
Massive capital investment (Goldwind got $6 billion low-interest loan from China Development Bank in 2010)
Redesigned processes to reduce costs (BYD’s manual labor substitution strategy)
Built domestic supply chains (China’s polysilicon production exploded)
Step 3: Leverage domestic market for scale (2010s-2020s)
China installed 127 GW of wind vs. 40 GW for entire rest of world (2024)
China’s EV sales exceeded 50% of global total
Domestic market provides guaranteed volume regardless of international conditions
Step 4: Expand internationally with overwhelming cost advantages (2020s-present)
Goldwind installed 5,458 MW outside China in 2024 (98% by just Goldwind and Envision)
CATL supplies every major Western automaker
Chinese turbines cost 40-70% less than Western equivalents
This isn’t a conspiracy. It’s industrial policy executed brilliantly over four decades. And it worked because Western companies made a critical mistake: they thought they were competing on technology when they were actually competing on scale.
The Geography of Competitive Advantage
Now we need to understand why the competitive landscape looks so strange: Chinese manufacturers dominating globally while Western manufacturers maintain strong positions in their home markets.
The Solar Story: Already Over Before It Began
If you want to see what the future of wind and batteries looks like, look at solar—because that race is already finished.
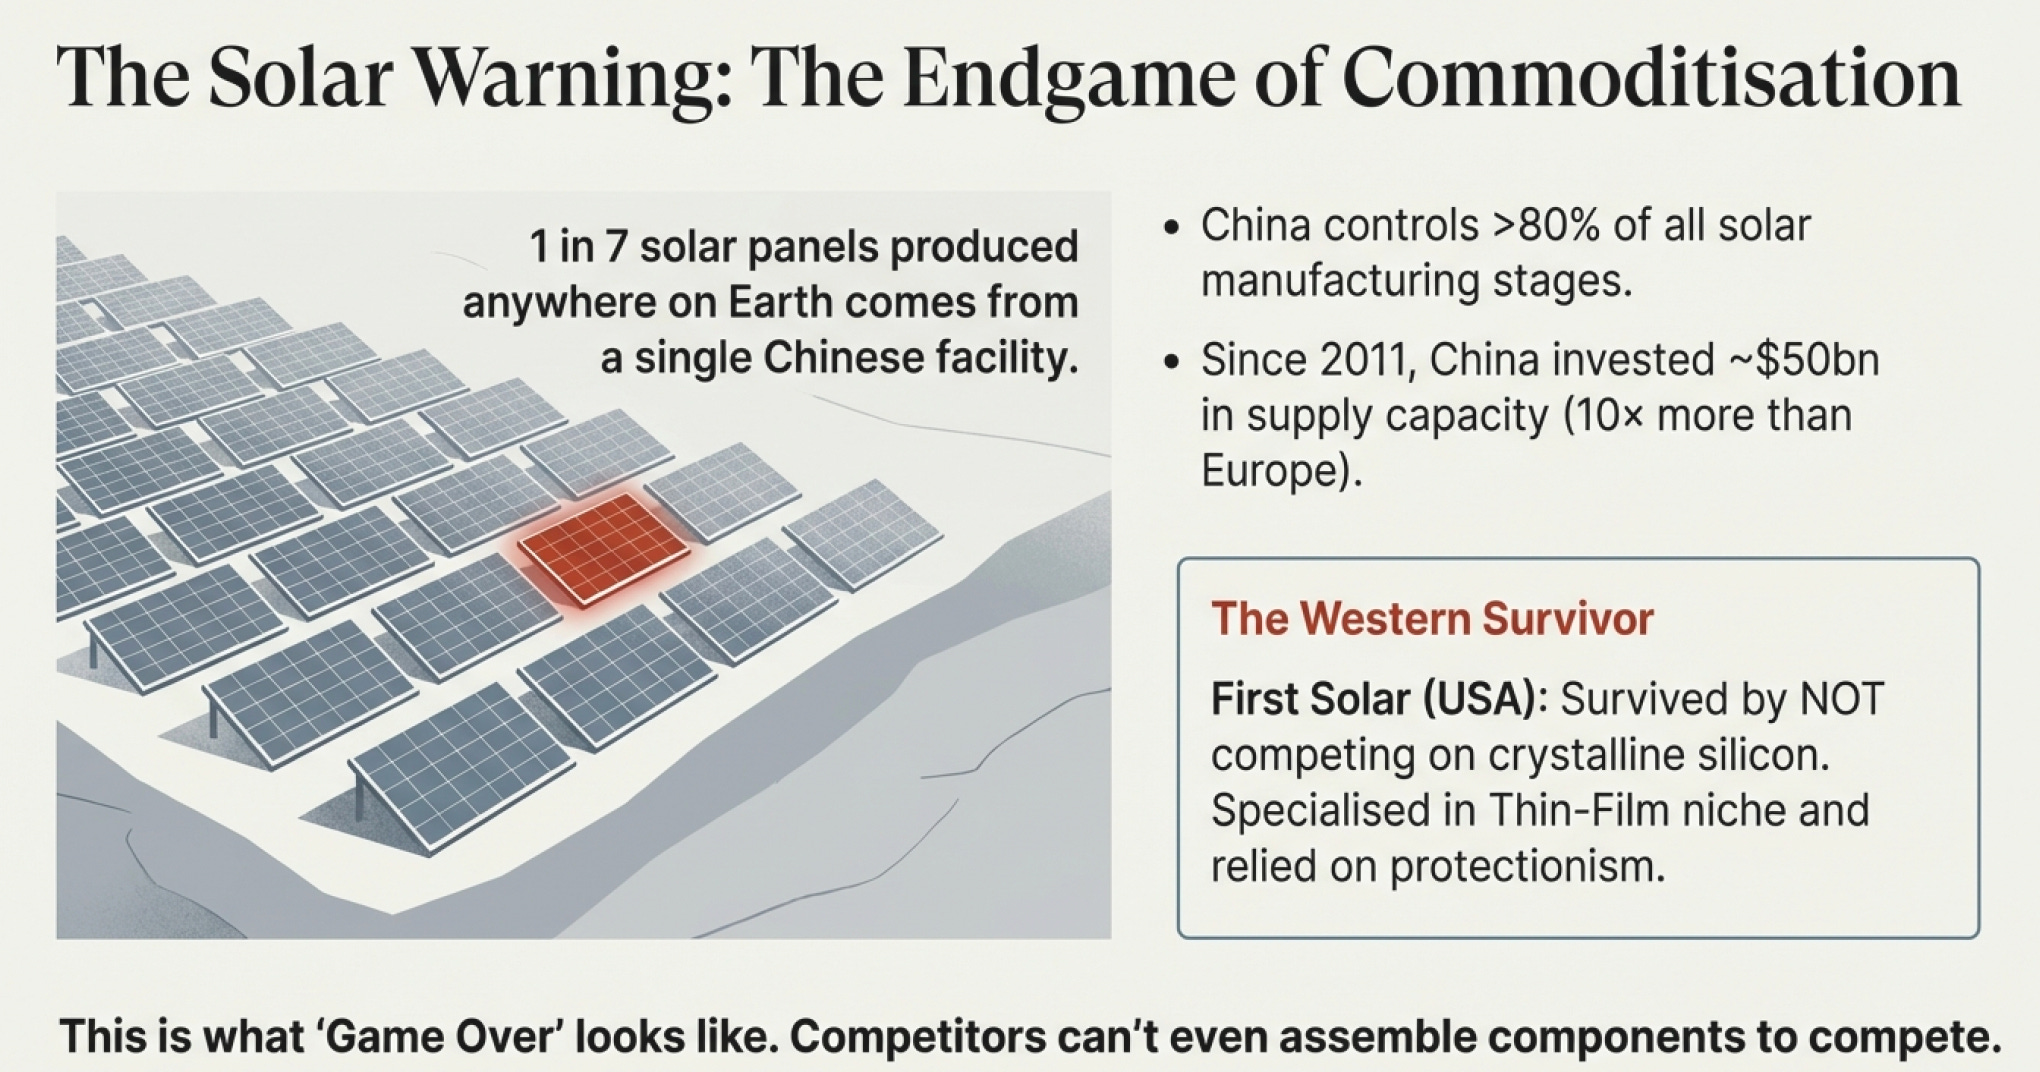
China’s share of all solar panel manufacturing stages exceeds 80%—more than double China’s share of global solar demand. Xinjiang province alone accounts for 40% of global polysilicon manufacturing. One out of every seven panels produced worldwide comes from a single facility.
Let that sink in. Not one out of seven Chinese panels. One out of every seven panels produced anywhere on Earth comes from a single Chinese facility.
The dominant players paint the picture:
LONGi Green Energy: World’s largest solar manufacturer
Trina Solar: Second globally
JinkoSolar: Strong third
Canadian Solar: Despite the name, primarily Chinese operations
First Solar: The lone significant Western player, surviving through thin-film specialization
China has invested over $50 billion in new PV supply capacity since 2011—ten times more than Europe. The global solar PV market was valued at $184-254 billion in 2024, but US solar panel manufacturing revenue was just $21.4 billion with only 22 businesses in the entire sector.
Meanwhile, China’s solar industry employed over 300,000 people in manufacturing alone.
This is what winning looks like: not just market share, but such dominance in every stage of the supply chain that competitors can’t even assemble the components to compete.
First Solar survives by specializing in thin-film technology (different chemistry, works better in specific conditions like high heat and low light), qualifying for US domestic content requirements, and accepting lower volumes at higher margins. That’s the Western playbook now: don’t compete head-to-head on cost for commodity products. Find a niche, defend it through technology or regulation, make sure margins justify lower volumes.
Why Geographic Segmentation Matters More Than Global Market Share
The market isn’t one global competition. It’s several regional competitions with different dynamics:
China (40-60% of Global Deployment):
Chinese manufacturers have 85-90% share in wind, 95% in solar manufacturing, 60%+ in batteries. This market is settled. Western companies have token presence at best. But here’s the critical insight: China installed more renewable energy capacity in 2024 alone than most countries have installed in total, ever.
The scale is incomprehensible to Western observers. Goldwind can install 20+ GW in a single year because the Chinese market absorbs that capacity without blinking.
Europe/North America (30-40% of Global Deployment):
Wind: European manufacturers hold 92% of European market (Vestas, Siemens Gamesa, Nordex)
Solar: First Solar maintains niche in thin-film; Chinese panels dominate volume
Batteries: CATL supplies everyone; LG and Samsung maintain presence in automotive
EVs: BYD rapidly gaining share; Tesla declining from 80% to 38% US market share (2020-2025)
Margins are better, regulatory requirements stricter, service networks matter more. This is where Western manufacturers make their stand—through quality reputation, regulatory advantages (domestic content requirements), and established relationships.
Emerging Markets (10-20%, Growing Fast):
Goldwind: 55.6% of installations in Asia outside China, 17.3% in Africa
Chinese manufacturers dominating due to cost advantages and financing relationships
Western manufacturers often overlook these markets (smaller projects, tighter margins)
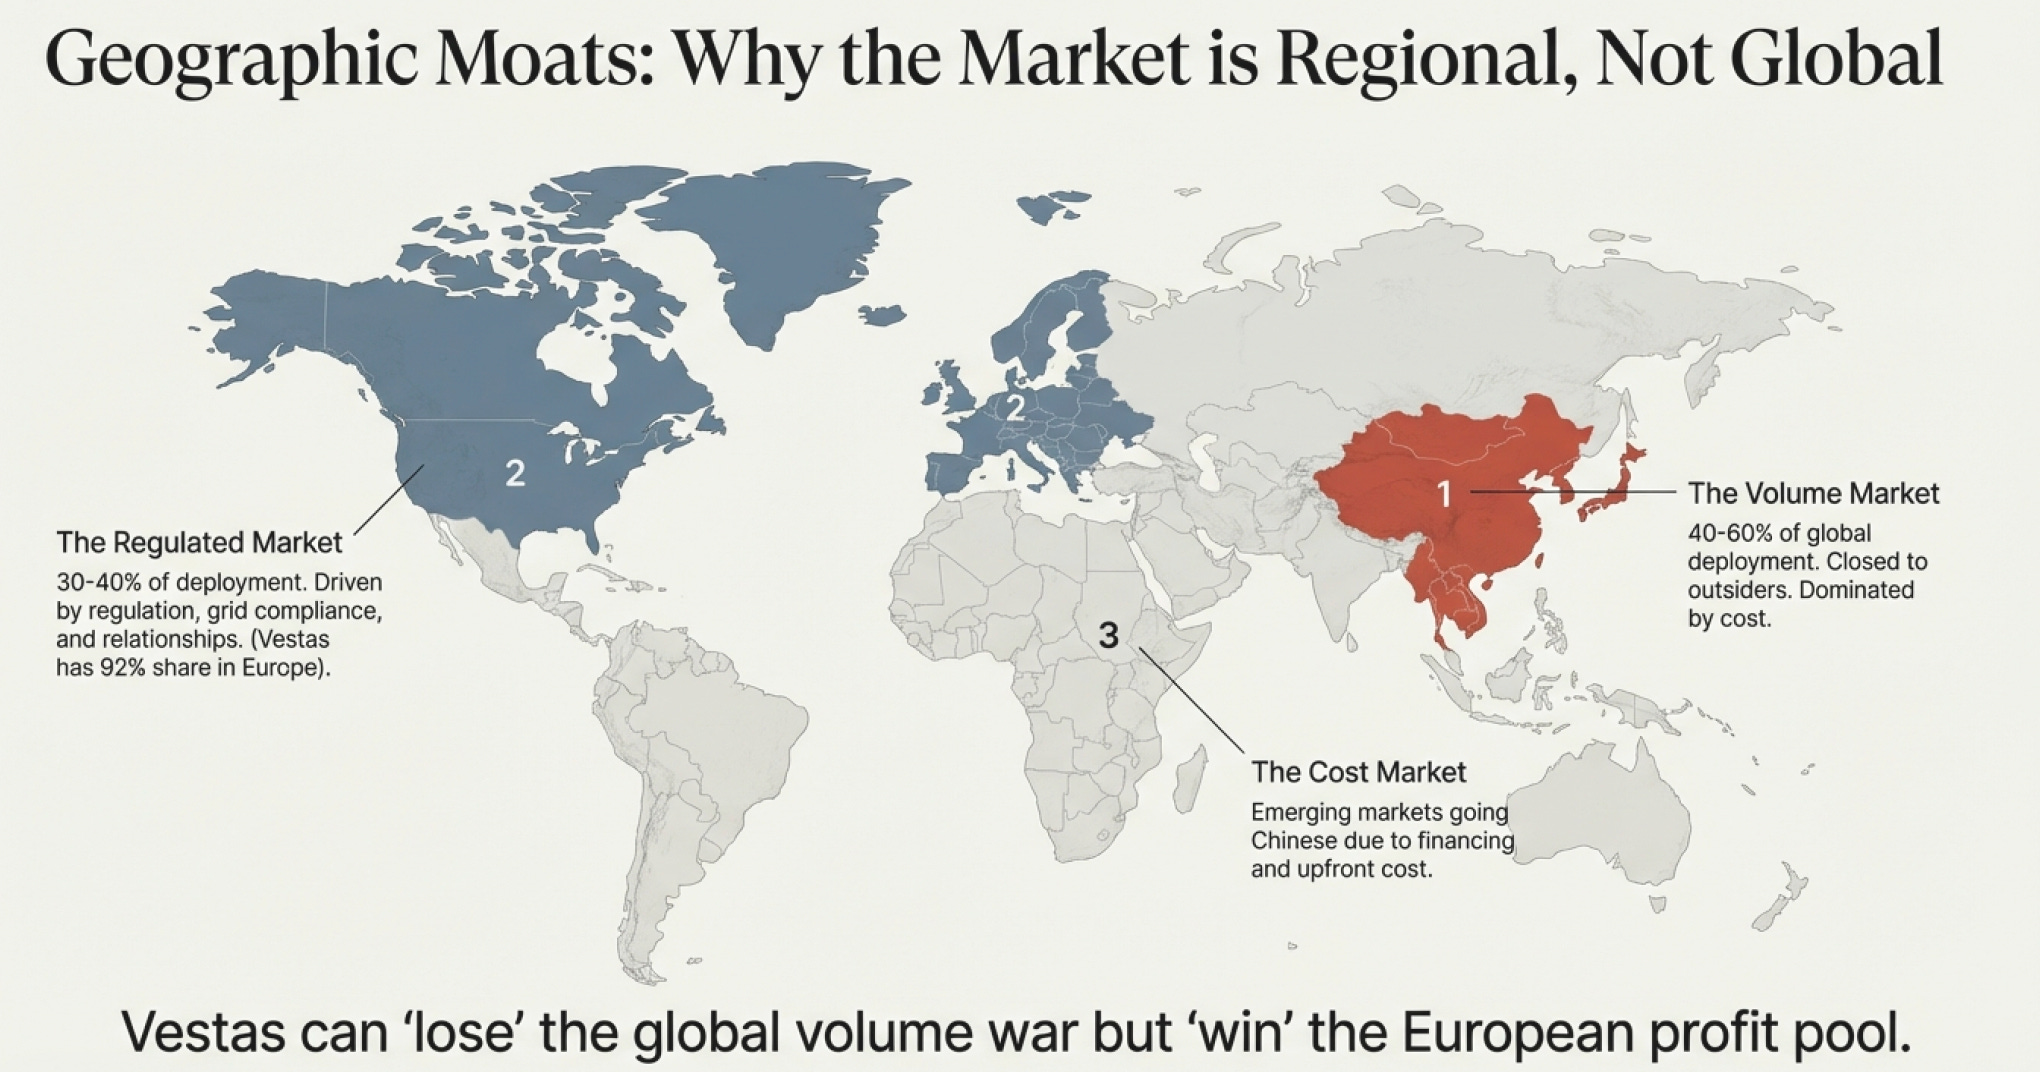
This geographic split is why Vestas can be “losing” globally (fallen to #5) while simultaneously “winning” in Europe (92% market share). Different segments, different competitive dynamics, different moats.
The Service Revenue Story: Western Companies’ Secret Weapon
Here’s what market share numbers miss entirely: Vestas has 164+ GW of installed capacity built over 40+ years. Those turbines need maintenance, parts, upgrades, eventual blade replacements. That’s decades of recurring revenue from an installed base that took generations to build.
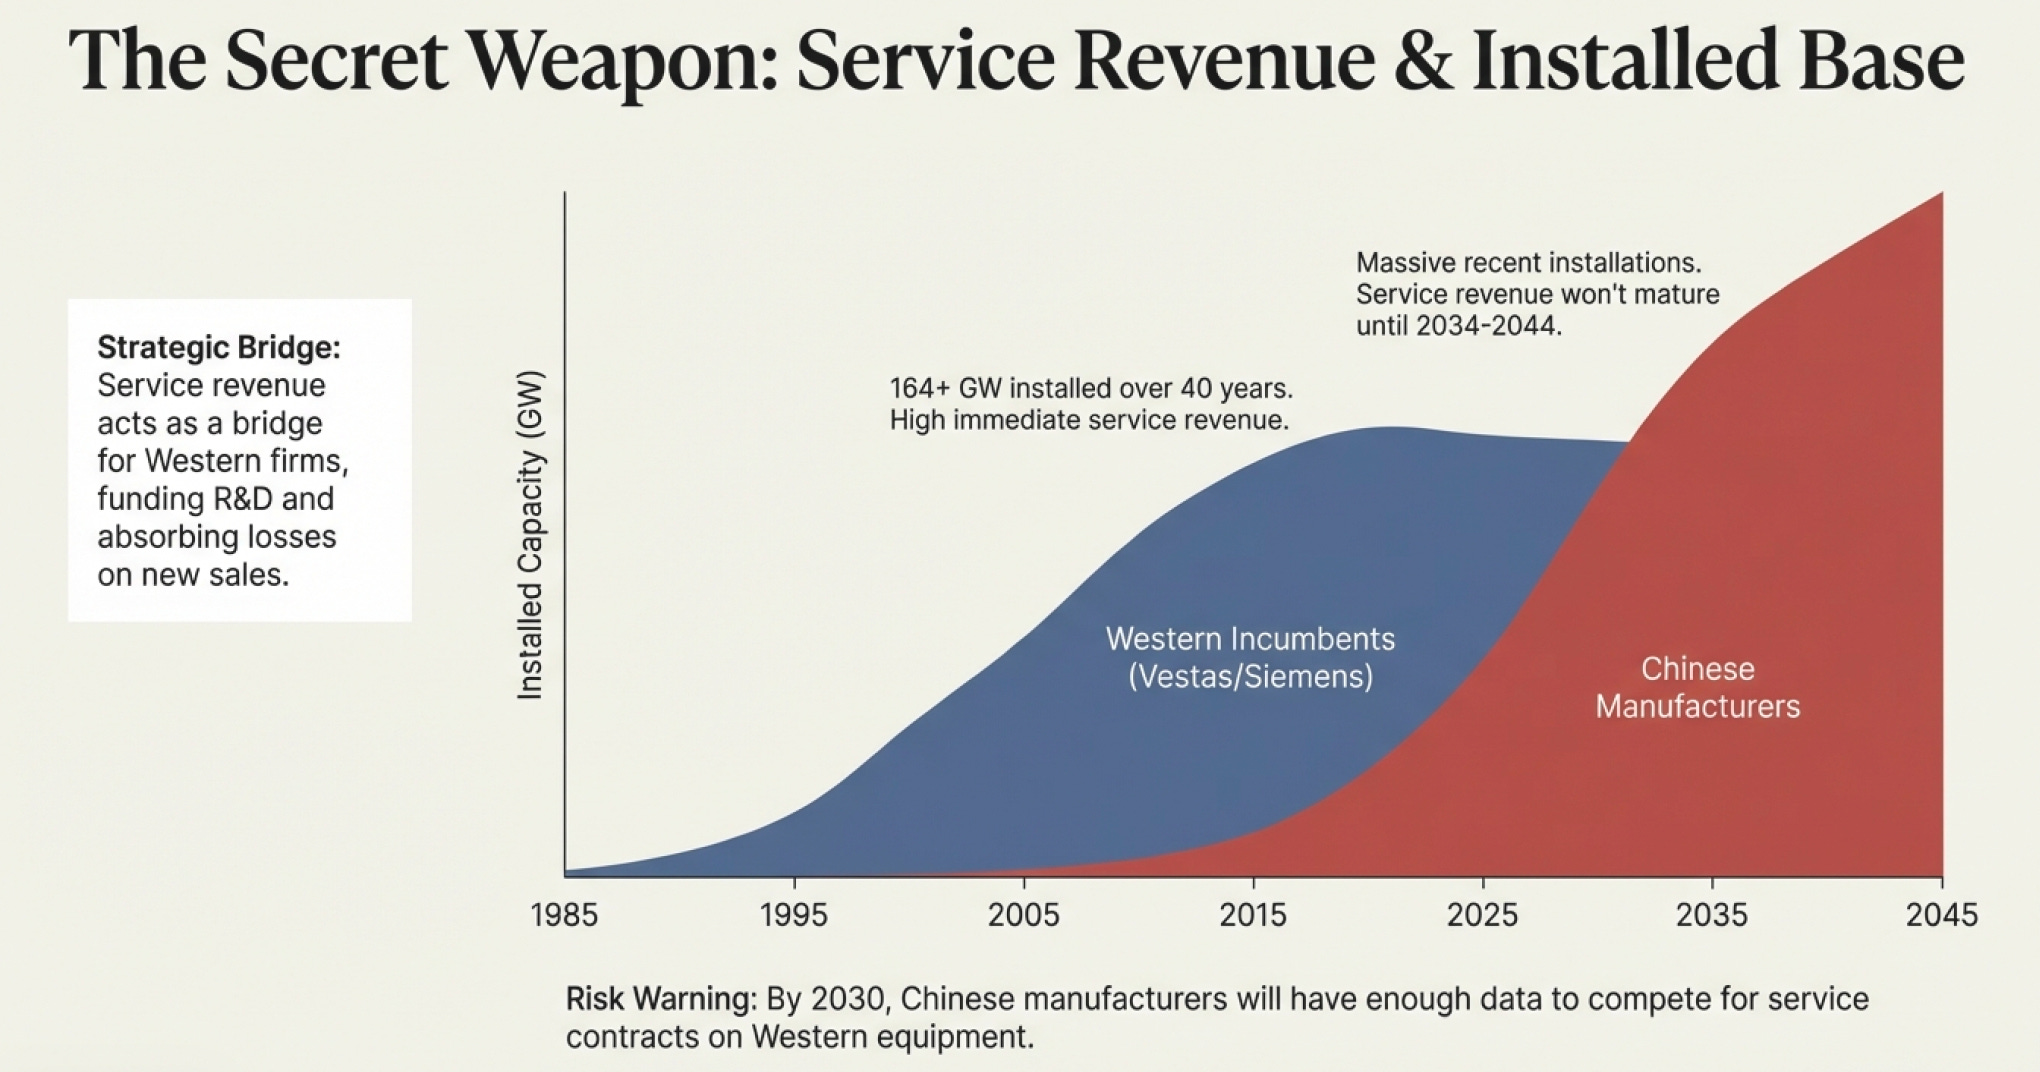
Siemens Gamesa has 137 GW installed. Same story.
Chinese manufacturers are building that installed base now—Goldwind hit 140 GW cumulative in 2024. But they won’t have comparable service revenue streams until the 2030s because turbines installed in 2024 won’t need major service work until 2034-2044.
This is Vestas’s bridge: sustain thin margins or even losses on new equipment sales today, make it back on service revenue from yesterday’s installations. Service revenue from legacy assets can fund R&D, absorb losses on competitive bids, and sustain the company through market downturns.
The strategic question: Can Western manufacturers defend this service revenue while Chinese manufacturers build their own installed base?
Early evidence suggests: It’s complicated. Customers value service continuity (you want the company that built the turbine to fix it), but not at any price. Equipment-specific knowledge matters initially, but every year Chinese manufacturers accumulate operational data, that advantage diminishes.
By 2030, Goldwind will have 15-20 years of service data on turbines operating in dozens of different environments. That’s when they can credibly compete for service contracts on any manufacturer’s equipment—not just their own.
The Profitability Paradox: When Everyone’s Winning, Nobody’s Making Money
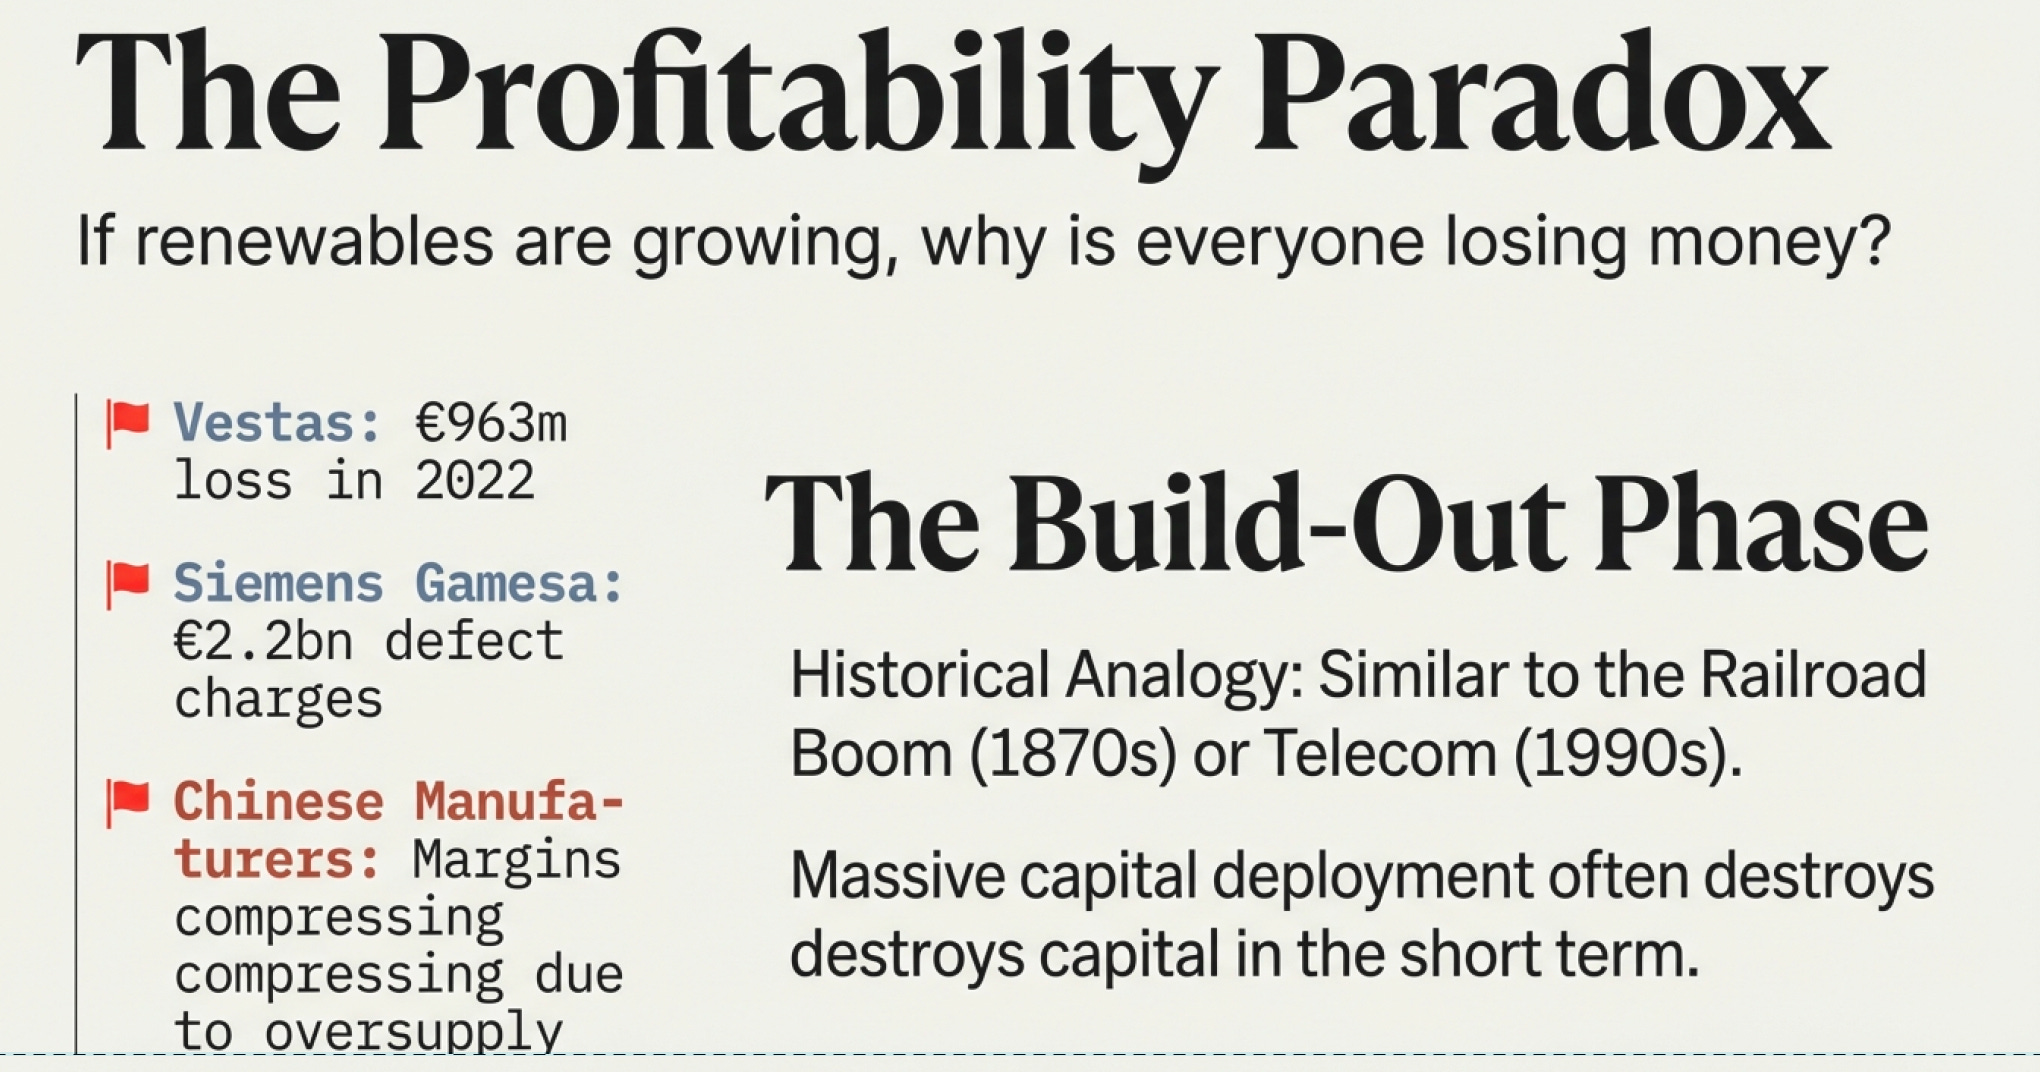
Despite dominating market share, many alternative energy manufacturers struggle with profitability:
Vestas reported €166 million losses in 2011, increasing to €963 million in 2012
Siemens Gamesa took €2.2 billion in charges for serial defects (2023)
US solar manufacturers saw profits crater due to low-cost imports (rebounded after tariff waivers expired in 2024)
Chinese wind manufacturers face declining profitability despite record installations, due to intense competition and oversupply
So everyone’s gaining share, capacity is growing, deployment accelerating... and nobody’s making money?
This is infrastructure during build-out phase. Compare to railroad boom (1830s-1870s), electricity grid build-out (1890s-1930s), or telecom infrastructure (1990s-2000s). Same pattern every time:
Phase 1 - Build-Out (We Are Here):
Negative or thin margins
Competition for market share
Winners determined by balance sheet strength and manufacturing efficiency
Government subsidies mask true economics
Massive capital deployment chasing growth
Phase 2 - Consolidation (Coming 2025-2030):
Weaker players exit or get acquired
Manufacturing capacity aligns with demand
Margins improve as competition rationalizes
Service revenue becomes increasingly important
Government subsidies begin phasing out
Phase 3 - Mature Cash Generation (2030s+):
Limited new manufacturing capacity additions
Dominant players have pricing power
Most revenue from service, upgrades, and replacements
High returns on invested capital
Infrastructure becomes “boring” utility-like business
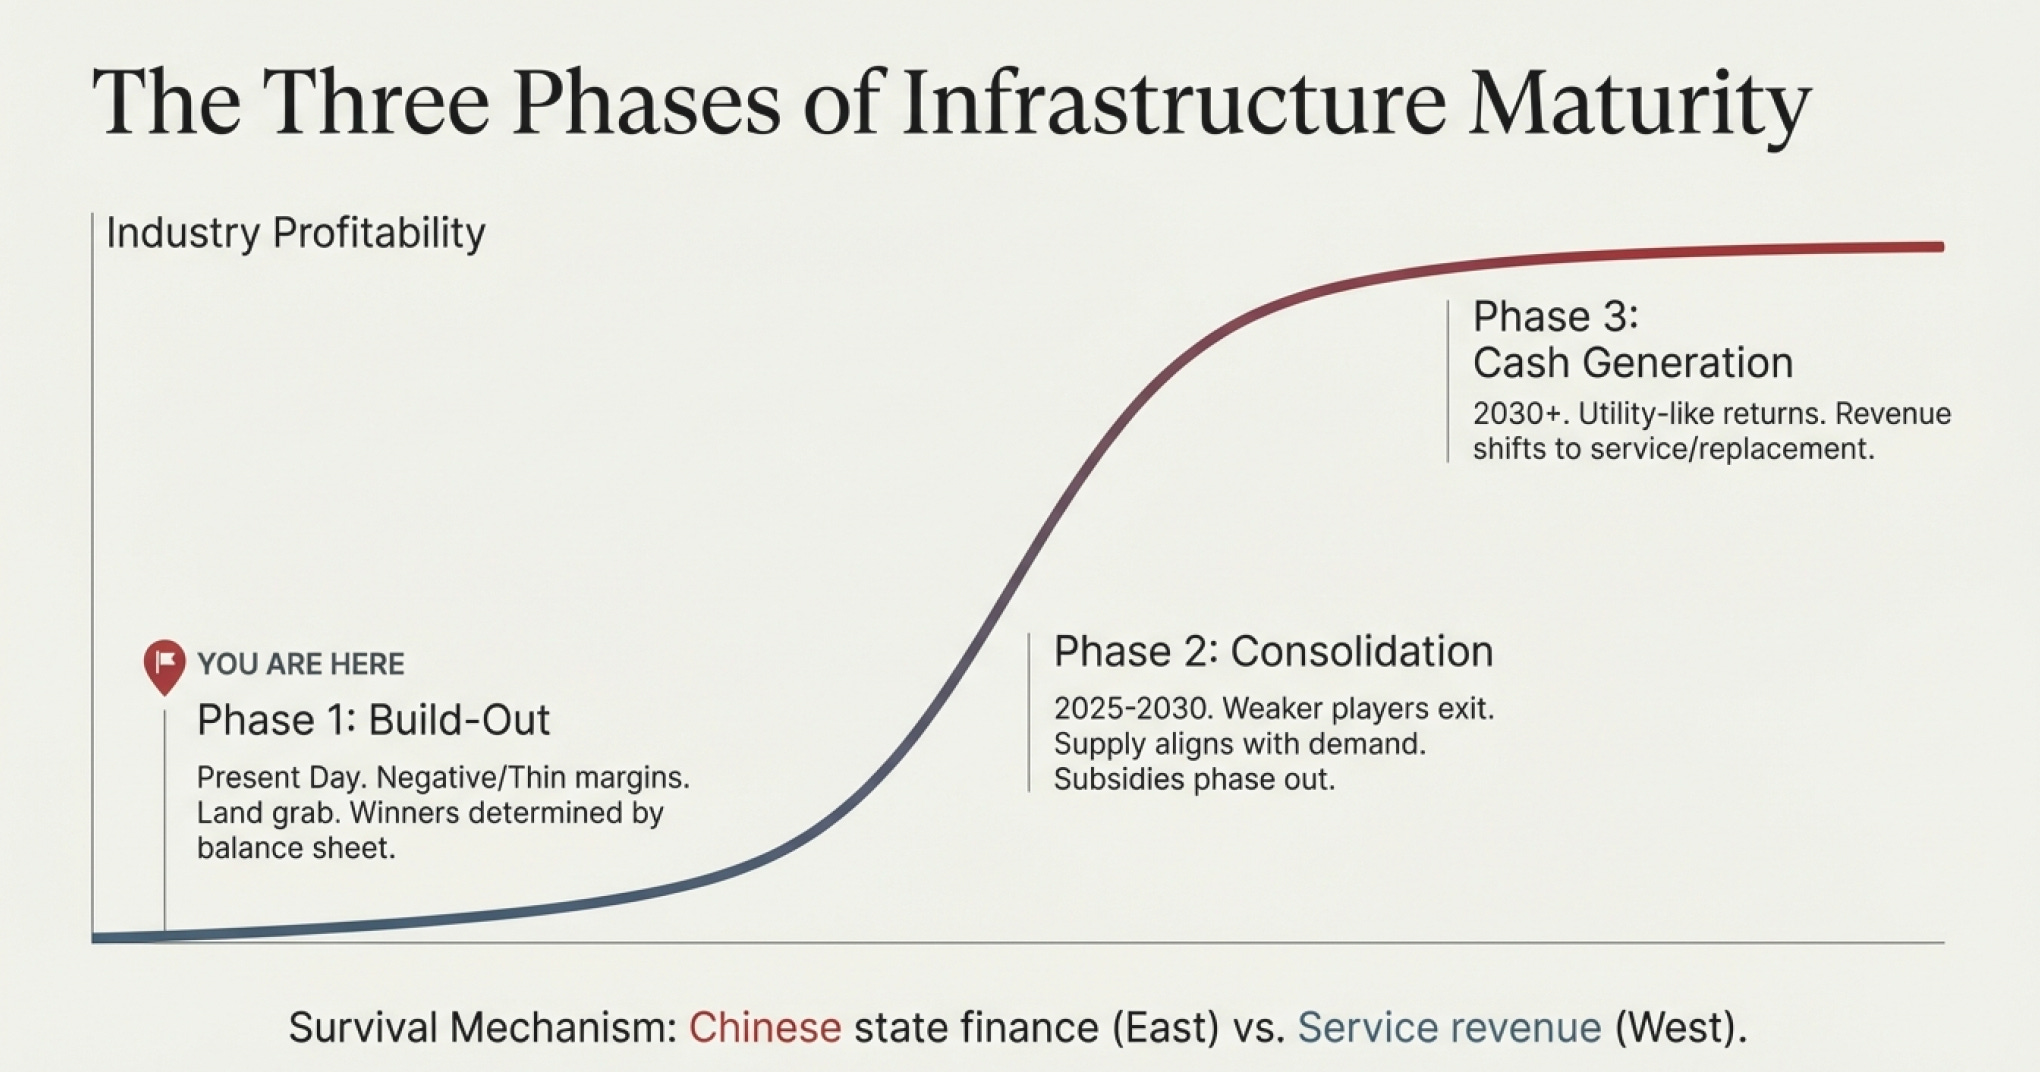
Chinese manufacturers have two massive advantages for surviving Phase 1:
First, state-backed financing means they can sustain losses longer than publicly traded Western competitors whose shareholders demand returns. When Goldwind got a $6 billion low-interest loan from China Development Bank, that wasn’t because banks thought they’d earn great returns—it was industrial policy.
Second, their domestic market provides baseline volume regardless of international market conditions. If export markets slow, Chinese manufacturers have guaranteed demand at home.
Western manufacturers have different advantages for Phase 2 and 3:
They have decades-long service contracts generating steady cash even when equipment sales are weak. They have stronger intellectual property positions (though this advantage is eroding). And they have incumbency in high-value markets where barriers are regulatory and relational, not just cost-based.
The investment insight: Profits will accrue to those who (a) survive Phase 1 with balance sheets intact, and (b) have defensible positions in specific segments. Right now, we’re watching a massive capital deployment cycle where economics are secondary to market share. That will change. The companies that survive to Phase 3 will be worth owning. Getting there requires either Chinese-scale advantages or Western niche defensibility.
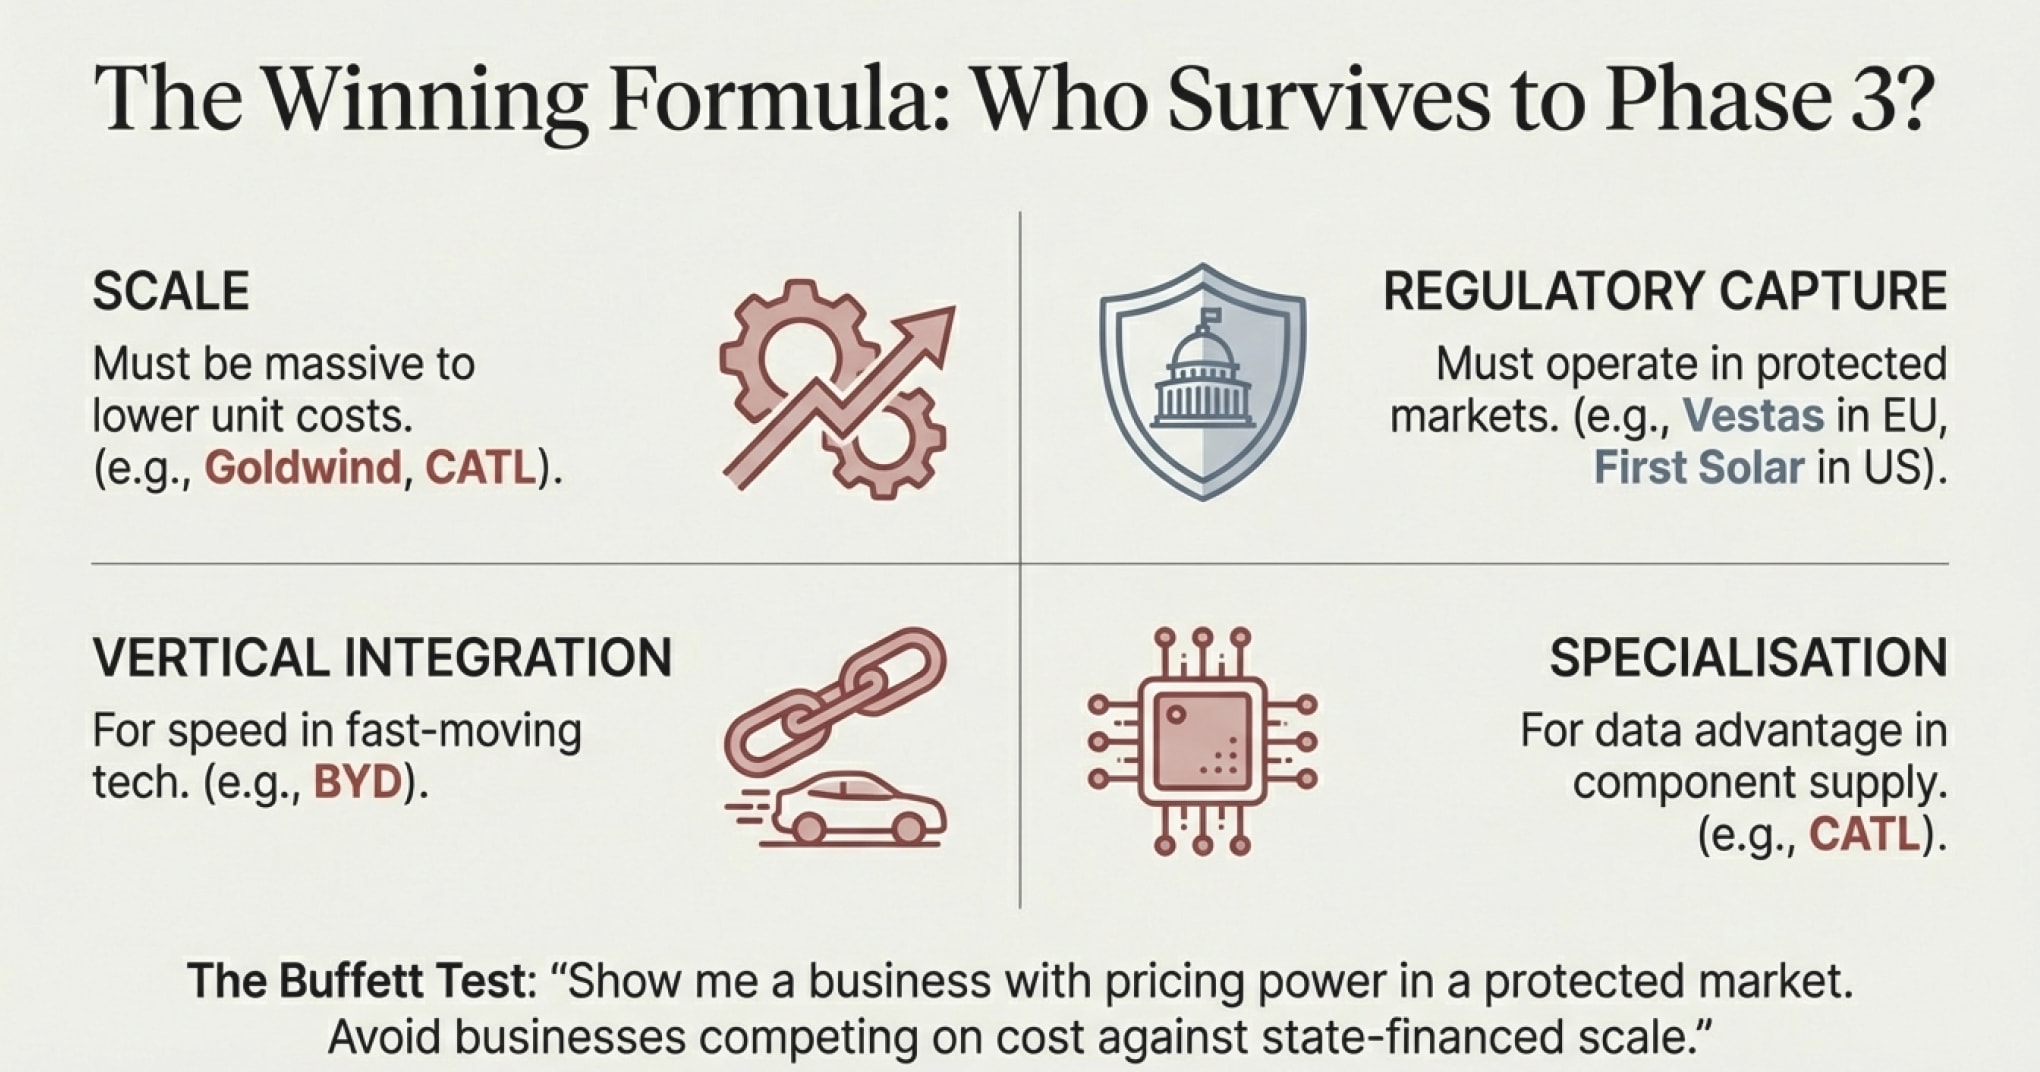
The Resolution: What Actually Determines Competitive Outcomes
After walking through these interwoven histories, here’s what actually matters:
Scale creates its own gravity. When you’re manufacturing 3x everyone else combined, your per-unit costs collapse, suppliers optimize around you, and competitors in neutral markets simply cannot compete. This is Goldwind’s advantage, CATL’s advantage, Chinese solar manufacturers’ advantage. It’s not that they’re better engineers—it’s that they see 3x more problems, 3x more solutions, and amortize R&D across 3x more units specific to their markets.
Regulatory capture beats cost advantages. Vestas maintains 92% European market share not because their turbines are cheaper (they’re 70% more expensive), but because customers value proven track records, established service networks, and regulatory compliance in their specific markets. First Solar survives because US domestic content requirements favor them. These moats are real but geographically limited.
Vertical integration wins in fast-moving markets. BYD’s ability to control batteries, motors, and vehicles let them iterate faster than competitors who must coordinate across corporate boundaries. When technology is evolving rapidly, controlling the full stack provides speed advantages that compound.
Specialization wins when technology matures. CATL supplies one in three EVs worldwide because automakers prefer buying from the best battery company rather than making their own. As batteries commoditize (which they’re rapidly doing), specialization advantages compound—more data, more edge cases, more optimization opportunities.
Geographic home-field advantage is persistent. Chinese manufacturers dominate China. European manufacturers dominate Europe. US manufacturers dominate US (less so, but still significantly). Neutral markets (Africa, Asia, Latin America) increasingly go Chinese due to cost advantages and financing relationships.
If Buffett were evaluating this landscape, he’d probably say: “Show me a business with genuine pricing power in a must-have product serving a protected market, and I’ll show you a good investment. Show me a business competing on cost in a commodity market with a competitor who has 10x your volume and state financing, and I’ll show you the door.”
Munger would add: “The alternative energy infrastructure is being built. That’s not in question. The question is: who captures the economic value from building it? Right now, Chinese manufacturers capture volume with thin margins, while Western manufacturers capture niches with better margins but lower volume. The overall profit pool is surprisingly small given the scale of deployment. That will change. The companies that survive to Phase 3 will be the ones worth owning. Getting there requires something durable—not just current market share.”
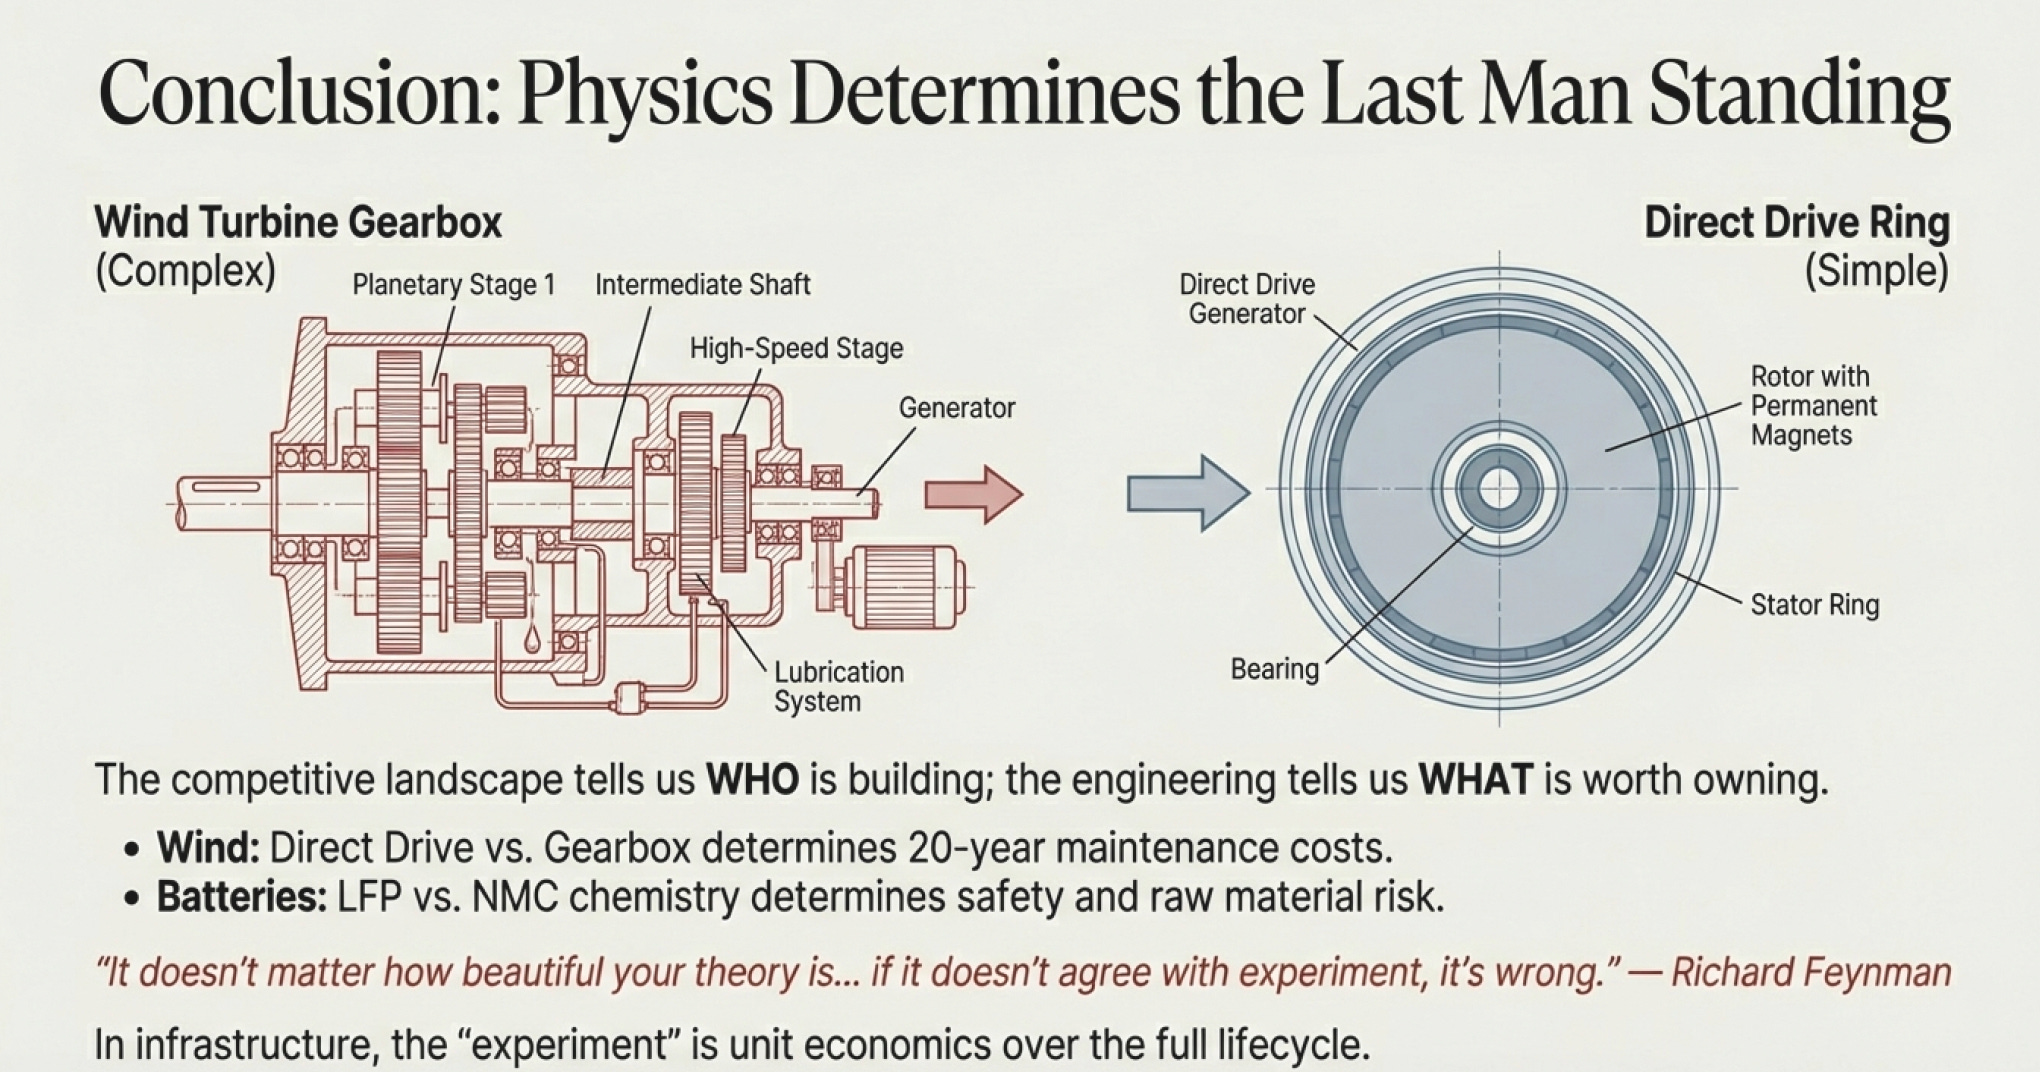
The Bridge to Technicals: Why Engineering Details Determine Who Survives
Now you understand the competitive landscape: who the players are, how they got here, why they’re positioned as they are. But here’s what we haven’t answered yet: Which technical advantages actually matter? Which engineering choices create durable moats versus temporary advantages?
When Goldwind bought permanent magnet direct-drive technology from Vensys in 2008, that wasn’t just acquiring specs—they bought a fundamentally different turbine architecture with different failure modes, different maintenance requirements, and different economics.
When CATL developed their cell-to-pack technology, that wasn’t just incremental improvement—it changed the thermal management requirements, structural integration possibilities, and cost structure of the entire battery system.
When First Solar specialized in thin-film (cadmium telluride) technology rather than crystalline silicon, they weren’t just choosing a different material—they chose a different efficiency curve, different temperature sensitivity, different degradation profile over 25+ years.
These technical choices have economic consequences that last decades. A wind turbine designed in 2015 will still be operating in 2045. The engineering decisions made today determine which companies can service what equipment, who has pricing power for replacement parts, and whose installed base becomes an asset versus a liability.
In our next section on Industry and Sector Technicals, we’ll dig into the engineering details that actually matter:
Why permanent magnet direct-drive turbines have 30% fewer failure points than gearbox turbines—and what that means for service revenue 20 years from now
How battery cell chemistry (NMC vs. LFP vs. solid-state) determines not just energy density but cycle life, thermal runaway risk, and raw material dependencies
Why thin-film solar has lower efficiency than crystalline silicon but better performance in high heat and low light—and which markets that matters in
What offshore wind engineering teaches us about which manufacturers can actually execute on their announced projects versus which are just good at press releases
How the physics of hydrogen fuel cells reveals why this technology keeps being “10 years away” decade after decade
Because in infrastructure investing, the devil is always in the engineering details. Companies can promise anything. Physics delivers what’s actually possible. And the gap between promise and physics is where most investment returns (or losses) actually come from.
As Feynman liked to say: “It doesn’t matter how beautiful your theory is, it doesn’t matter how smart you are. If it doesn’t agree with experiment, it’s wrong.”
In infrastructure investing, substitute “experiment” with “unit economics over full lifecycle,” and you’ve got the key to separating real businesses from promotional stories.
The competitive landscape tells us who’s building what and where. The technicals will tell us whose assets are actually worth building—and whose are just expensive science experiments disguised as infrastructure investments.
Let’s find out which is which…
For part 1 - Industry Fundamentals: click here
For part 2 - Business & Competitive Landscape: click here
For part 3 - Industry and Sector Technicals: click here
References
Alternative Energy Primer – Part 2
https://compoundingzero.substack.com/p/alternative-energy-primer-part-2The Economics of Renewable Energy
https://www.iea.org/reports/renewable-energy-market-updateLevelized Cost of Energy Analysis (LCOE)
https://www.lazard.com/research-insights/levelized-cost-of-energy-levelized-cost-of-storage-and-levelized-cost-of-hydrogen/Learning Rates and Cost Declines in Solar PV
https://www.nrel.gov/docs/fy21osti/78228.pdfExperience Curves for Wind and Solar Energy
https://www.sciencedirect.com/science/article/pii/S0301421518307266Why Solar Is the Cheapest Electricity in History
https://www.iea.org/reports/world-energy-outlook-2020China’s Dominance in the Global Solar Supply Chain
https://www.iea.org/reports/solar-pv-global-supply-chainsPhotovoltaics Manufacturing and Cost Structure
https://www.pveducation.org/pvcdrom/manufacturingPolysilicon, Wafers, Cells, and Modules Value Chain
https://www.iea.org/reports/the-role-of-critical-minerals-in-clean-energy-transitionsGlobal Wind Energy Market Development
https://gwec.net/global-wind-report-2023/Wind Power Economics and Cost Trends
https://www.nrel.gov/docs/fy23osti/84707.pdfOnshore vs Offshore Wind Cost Comparison
https://www.iea.org/reports/offshore-wind-outlook-2019Chinese Wind Turbine Manufacturers and Market Share
https://www.woodmac.com/news/opinion/chinas-wind-turbine-manufacturers-go-global/Goldwind Company Overview
https://en.wikipedia.org/wiki/GoldwindEnvision Energy Company Overview
https://en.wikipedia.org/wiki/Envision_EnergyVertical Integration in Renewable Energy Manufacturing
https://www.sciencedirect.com/science/article/pii/S0301421519307865Capital Intensity and Scale Effects in Solar Manufacturing
https://www.sciencedirect.com/science/article/pii/S1364032118305167Industrial Policy and Clean Energy Manufacturing
https://www.nber.org/papers/w30042China’s Renewable Energy Industrial Strategy
https://www.reuters.com/world/china/china-bets-renewables-industrial-policy-2023-11-28/Solar Module Overcapacity and Price Compression
https://www.reuters.com/markets/commodities/solar-panel-prices-collapse-china-2024-01-15/Global Solar Module Price Trends
https://about.bnef.com/blog/solar-module-prices-hit-record-lows/Competitive Dynamics in Renewable Energy Markets
https://www.sciencedirect.com/science/article/pii/S0140988320303211Energy Transition Investment Trends
https://about.bnef.com/energy-transition-investment/Grid Parity and Renewable Energy Adoption
https://www.sciencedirect.com/science/article/pii/S0301421518305607Power Purchase Agreements and Renewable Economics
https://www.nrel.gov/docs/fy21osti/78924.pdfCommodity Inputs for Renewable Energy Technologies
https://www.iea.org/reports/critical-minerals-market-review-2023Economies of Scale in Renewable Energy Deployment
https://www.sciencedirect.com/science/article/pii/S1364032121006349Renewable Energy and Deflationary Technology Trends
https://www.mckinsey.com/industries/electric-power-and-natural-gas/our-insights/the-net-zero-transition-what-it-would-cost-what-it-could-bringSolar PV as a Manufactured Energy Technology
https://www.sciencedirect.com/science/article/pii/S0301421519305257Global Energy Transition Outlook
https://www.irena.org/Publications/2023/Jun/World-Energy-Transitions-Outlook-2023Competition and Margin Pressure in Solar Manufacturing
https://www.ft.com/content/1bh7b8a8-0b39-4c3f-bfa3-9c08d8d9e2b3Renewable Energy as a Capital Goods Industry
https://www.sciencedirect.com/science/article/pii/S1364032120307491Long-Term Marginal Cost of Electricity from Renewables
https://www.sciencedirect.com/science/article/pii/S0301421518301646Global Electricity Generation Cost Benchmarks
https://www.iea.org/reports/projected-costs-of-generating-electricity-2020Renewable Energy Market Structure and Profitability
https://www.sciencedirect.com/science/article/pii/S0301421522002379