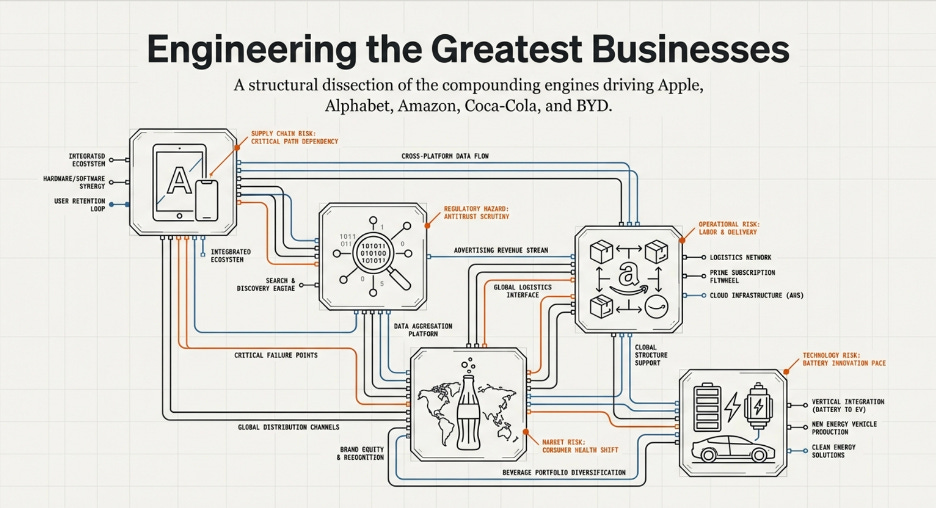
Copying Without Pride: Engineering the Greatest Businesses
A SOYA Investing Case Study — Apple · Alphabet · Amazon · Coca-Cola · BYD

Preface
The five companies in this paper were each identified as exceptional investments years before the wider market agreed. Not through luck. Not through access to information others did not have. Through a way of reading businesses that most financial training actively discourages — one that looks past this quarter’s earnings and asks a different question entirely: how long can this business keep doing what it is doing right now?
That question sounds simple. Answering it rigorously is the work of a lifetime.
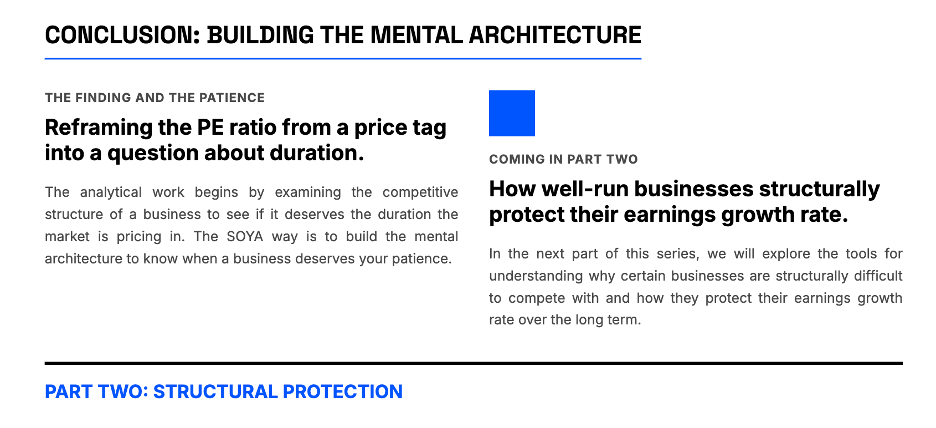
What follows is the framework behind those five investments — and behind every investment worth holding for a decade. It begins by reframing the most misused metric in public markets. It then builds, piece by piece, the tools for understanding why certain businesses are structurally difficult to compete with. And it ends with the five case studies themselves, each dissected to show exactly why they qualified — and where the limits of that qualification sit.
The discipline of holding great businesses through the noise of markets and the second-guessing of peers has a name: SOYA investing. Sit On Your Ass. Charlie Munger refined it over 50 years. The principle is that the greatest returns in equity do not come from more frequent action. They come from finding a business whose advantages will compound for a very long time, buying it before the market has fully priced how long that will be, and then having the patience to let the compounding run. The finding and the patience are both hard. Most investors fail at the patience even when they succeed at the finding.
This paper is about the finding. Specifically, it is about building the mental architecture to know — with conviction — when a business deserves your patience.
Part One: The PE Ratio Is a Question, Not an Answer
The Number Everyone Quotes and Almost Nobody Understands
The price-to-earnings ratio is the first metric any analyst reaches for and the one most consistently misread. Ask a room full of fund managers what a PE of 30 means and the answer will come back as a comparison: expensive relative to the market, or cheap relative to its sector, or in line with its historical average. What will almost never come back is a description of what the number is actually saying about the business — what belief about the future it encodes.
Here is a cleaner way to think about it.
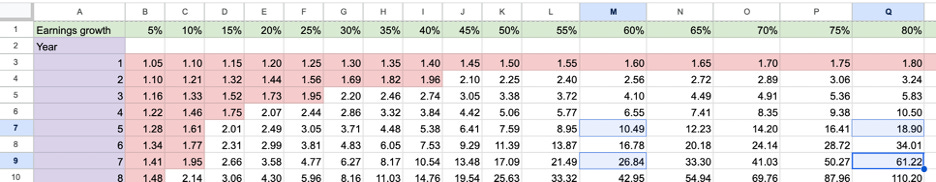
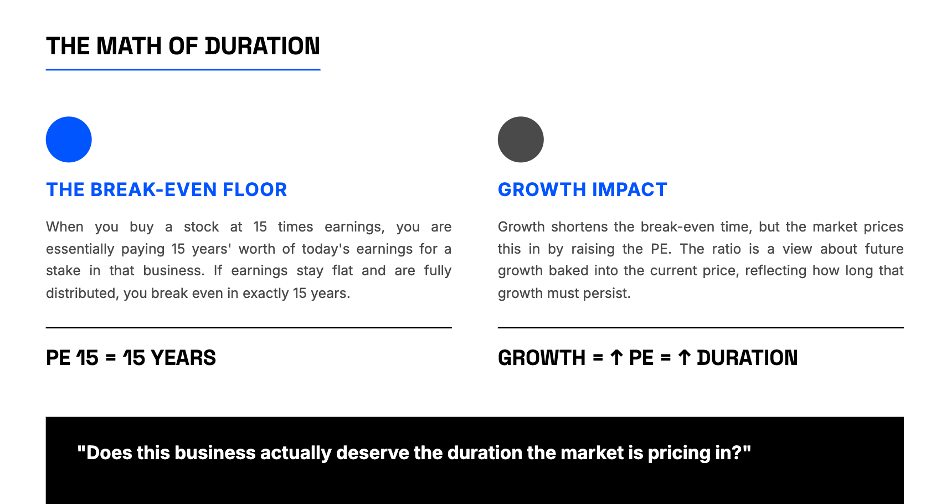
When you buy a stock at 15 times earnings, you are paying 15 years’ worth of today’s earnings for a stake in that business. If the business earns exactly the same amount every year for the next 15 years and distributes all of it, you have broken even in nominal terms. That is the floor — the case where nothing about the business changes. But of course, businesses do not stay flat. They either grow or they shrink. And the price you paid — 15 times earnings — already has a view about which direction it will go baked into it.
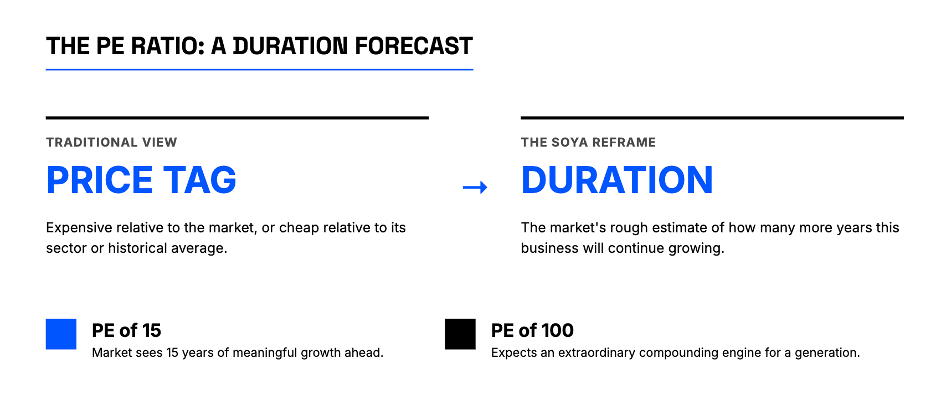
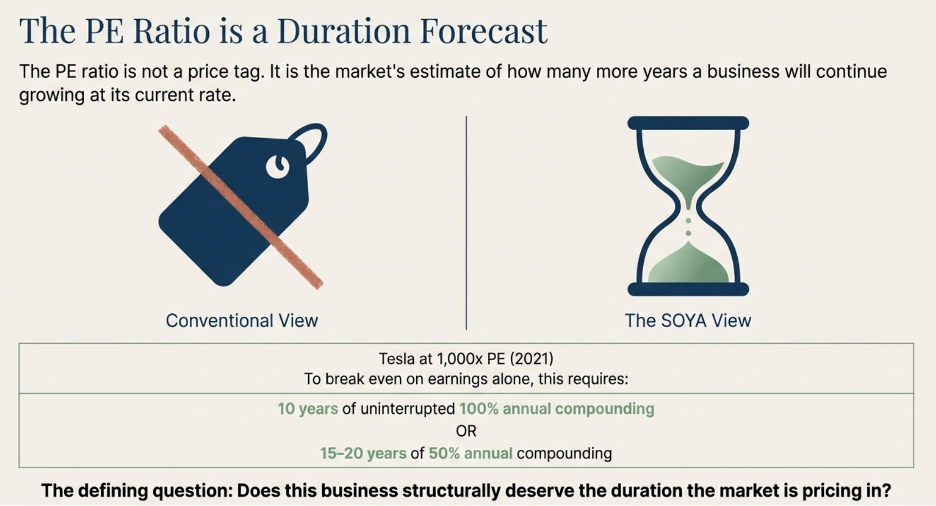
Think of the PE ratio this way: it is the market’s rough estimate of how many more years this business will continue growing at approximately its current rate. A PE of 15 says the market sees perhaps 15 more years of meaningful growth ahead. A PE of 40 says it sees far more — four decades worth, or growth at a rate that more than compensates for fewer years. A PE of 100 says the market expects this to be an extraordinary compounding engine for a generation, or it has completely lost its grip on rational valuation. The number is not a price tag. It is a duration forecast.
That reframe changes everything about how you use the metric. The question is no longer “is this PE high or low?” The question is: does this business actually deserve the duration the market is pricing in?
This is where the real analytical work begins, and it is what the rest of this framework is built to answer.
When Precision Matters, and When Approximation Is Enough
The PE-as-duration framework can be made mathematically precise, and there are situations where that precision is exactly what you need.
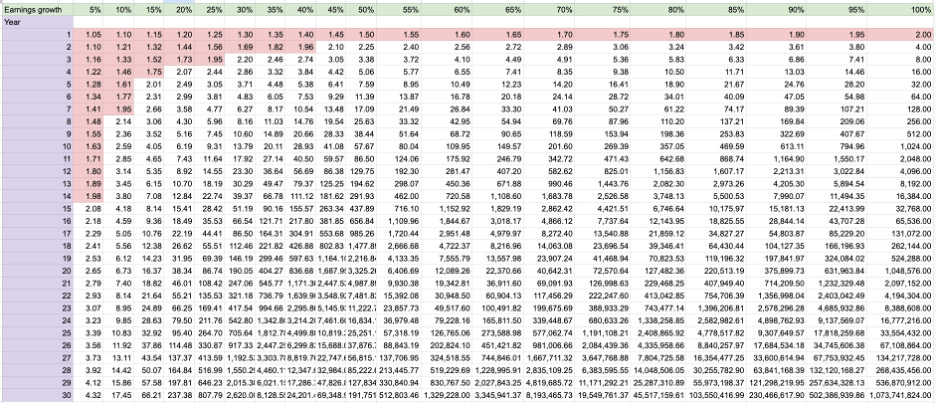
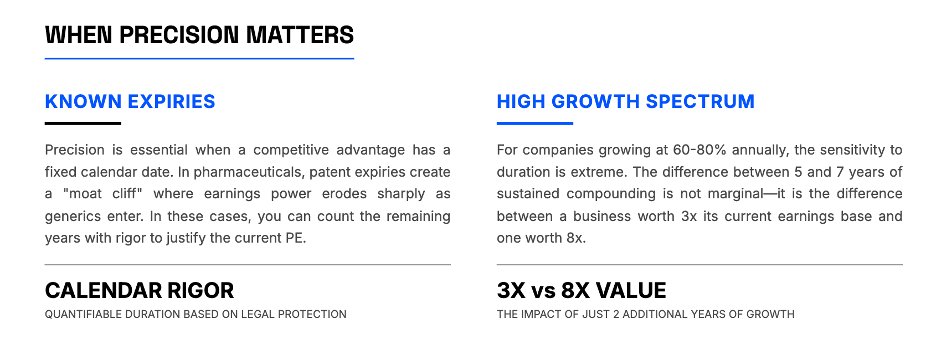
The clearest case is a business whose competitive advantage has a known expiry date. A pharmaceutical company with a patented drug, for instance, has a moat that will legally cease to exist on a specific calendar date. When that patent expires, generic manufacturers will enter the market, prices will collapse, and the earnings power that justified the current valuation will erode sharply. In that situation, you can count the years until expiry, examine the earnings growth rate, and work out with reasonable rigor whether the current PE is justified by the duration that remains. The table does what it says: it translates growth rate and years into a valuation anchor. The precision is available and it matters.
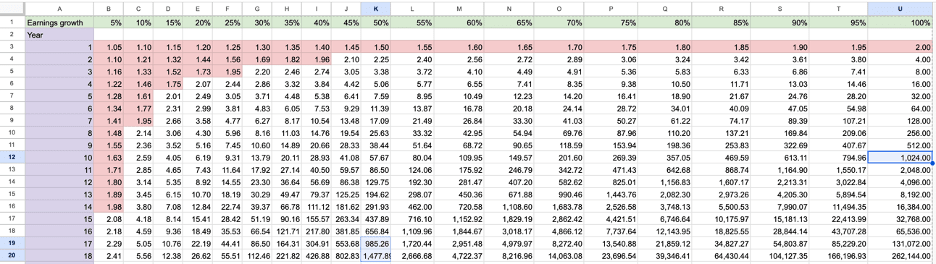
The other situation where exactness is warranted is at the high end of the growth spectrum. When a business is growing earnings at 60% or 80% per year, the difference between five years of that growth and seven years is not marginal — it is the difference between a business worth three times its current earnings base and one worth eight times. Each additional year of high-rate compounding adds so much terminal value that your duration estimate has to be reasonably precise to avoid a large valuation error in either direction. For high-growth companies, the table is a useful guard against both excessive generosity and excessive cynicism about how long the growth can run.
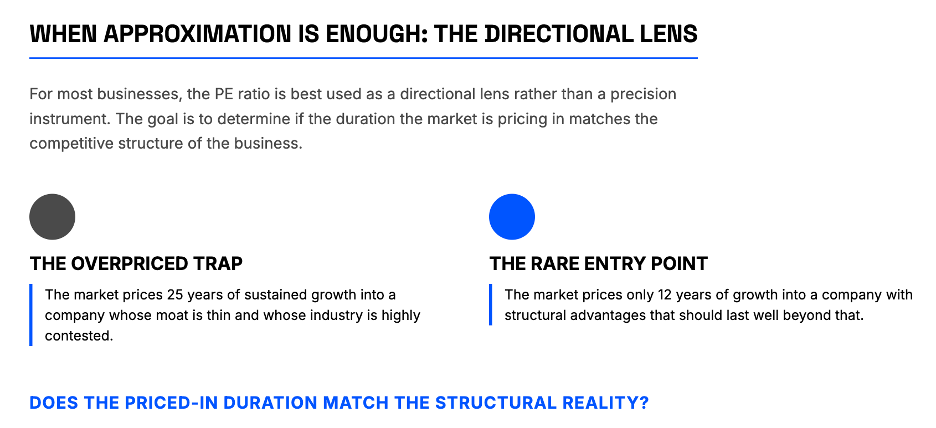
For most businesses, though, and for the five in this study, the PE ratio is best used as a directional lens rather than a precision instrument. The question it is helping you answer is coarser but no less important: does the duration the market is pricing into this stock match what you can see when you examine the competitive structure of the business? If the market is pricing 25 years of sustained growth into a company growing at 10% whose moat is thin and whose industry is contested, the stock is mispriced regardless of how attractive the brand feels. If the market is pricing 12 years of growth into a company with structural advantages that should last well beyond that, you may be looking at an entry point.
The framework in Part Two is what makes that assessment possible. But before building it, there is one example worth walking through in detail — not because the math resolves neatly, but because the reasoning it demands illustrates exactly what the duration frame is for
.
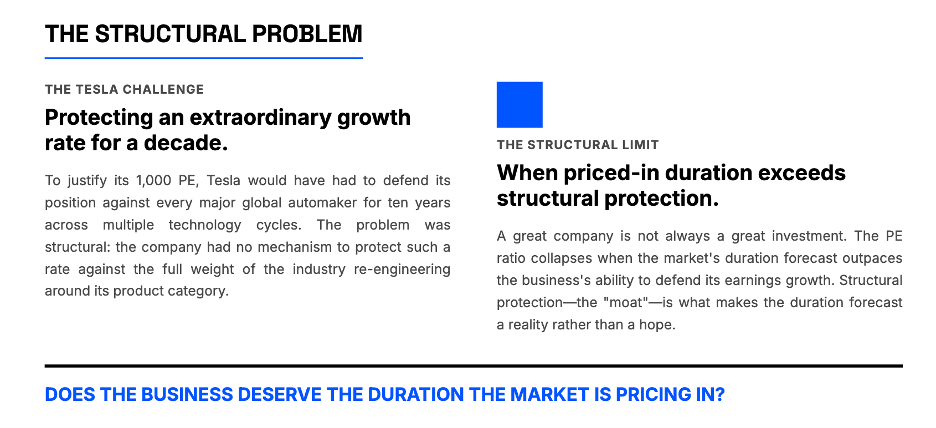
Tesla at 1,000 Times Earnings: What the Table Actually Tells You
In late 2021, Tesla’s stock briefly reached a valuation of approximately 1,000 times trailing earnings. Most commentary at the time reached for peer comparisons — Tesla versus Toyota, Tesla versus GM — to illustrate how extreme the number was. That comparison, while viscerally satisfying, misses the more important analytical question. The right frame is not “how does this compare to other car companies?” The right frame is: what does a PE of 1,000 require to be true about the business, and is any of it visible in Tesla’s actual competitive structure?
Start with the table. A PE of 1,000 at a 100% annual earnings growth rate — which would rank among the highest sustained earnings growth rates ever achieved by a large-cap company — still requires approximately 10 years of uninterrupted compounding before the investment recovers its cost from earnings alone. Ten consecutive years of doubling earnings, just to break even on the entry price. That is the floor, not the ceiling. At a more realistic and still very aggressive 50% annual earnings growth, the duration extends to somewhere between 15 and 20 years. The table is not being conservative here. It is doing arithmetic.
Now ask the obvious question: what would need to be true about Tesla’s competitive position for 10 to 20 years of extraordinary earnings growth to be achievable?
The answer is that Tesla would need to defend its position in the electric vehicle market against every serious competitor that entered for that entire period without its earnings growth rate meaningfully declining. Not just for one year, not just through one competitive cycle, but for a decade or more — across multiple generations of EV technology, multiple rounds of battery innovation, and against the full weight of every major automaker in the world re-engineering their businesses around the exact product category Tesla had pioneered.
This is where the PE of 1,000 collapses under inspection. Not because Tesla was a poor company — it was, by any reasonable measure, a genuinely impressive manufacturer that fundamentally changed the trajectory of the industry. The problem is structural: Tesla had no mechanism to protect the earnings growth rate that the PE was pricing in. This brings us to our next section: How can/ does a well-run business structurally protect their earnings growth rate (which brings up to our next section — structural advantages which protects a business earnings, and its growth).
Part Two: What Actually Protects a Business
Forget Porter. Focus on One Thing.

Michael Porter’s Five Forces framework is taught in every MBA programme in the world. It is genuinely useful for one purpose: generating a structured list of industry characteristics to discuss in a strategy meeting. As a tool for identifying whether a business has a durable competitive advantage, it is largely a distraction.
The reason is that four of the five forces are not causes — they are symptoms. A business experiencing intense competitive rivalry does so because barriers to entry are low enough that new competitors found it rational to enter. A business suffering from supplier power does so because it lacks the supply-side advantages that would give it pricing leverage over its own inputs. A business facing powerful buyers does so because it has not established the switching costs or habits that reduce those buyers’ negotiating position. The threat of substitutes is simply a restatement of whether customer captivity is strong enough to resist alternatives.
Strip away the symptoms and what remains is the one force that actually matters: barriers to entry. If barriers to entry are high enough, competitive rivalry stays manageable. Supplier power stays containable. Buyer power stays limited. The threat of substitutes stays low. Everything else in Porter’s model is a downstream consequence of this one upstream condition.
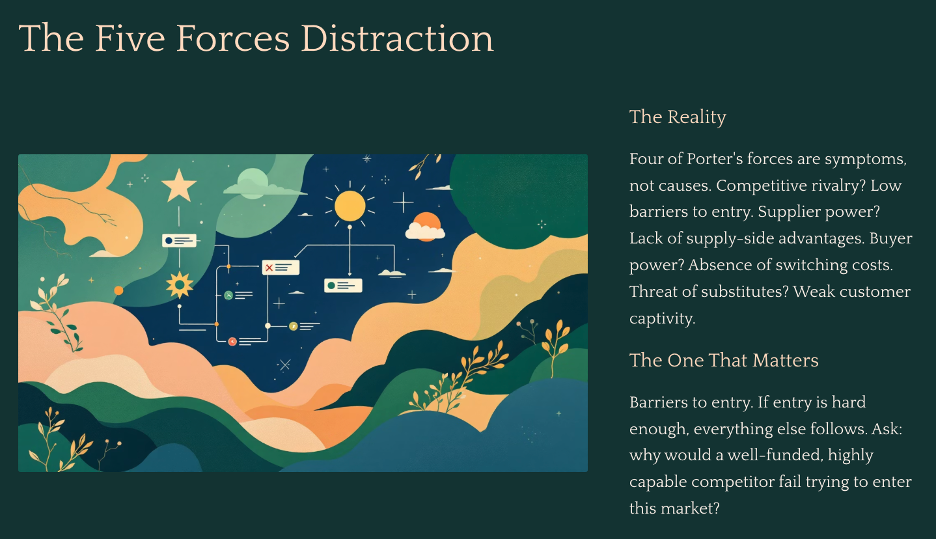
This simplification changes how you look at businesses. Instead of working through five parallel analyses, each producing its own list of considerations, you ask one question: why would a well-funded, highly capable competitor — a serious team with patient capital, strong talent, and no resource constraints — fail if they tried to enter this market today? If the honest answer is that they would gain meaningful traction within three to five years, the business has no durable moat. If the honest answer is that they would fail, and you can articulate the precise structural mechanism by which they would fail, then you have found something worth examining deeply.
Barriers to entry come from two directions. Every business faces its customers on the demand side, and the rest of the world on the supply side. A barrier can come from either, or — in the most powerful businesses — from both simultaneously.
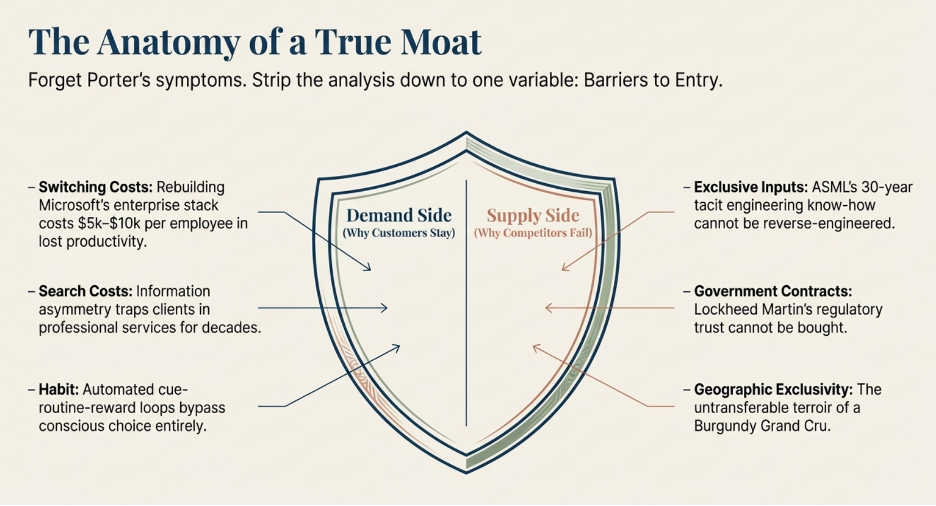
The Demand Side: Three Reasons Customers Stay
Demand-side barriers work by making it costly or difficult for customers to leave, regardless of how good a competitor’s product becomes. There are three distinct mechanisms through which this happens.
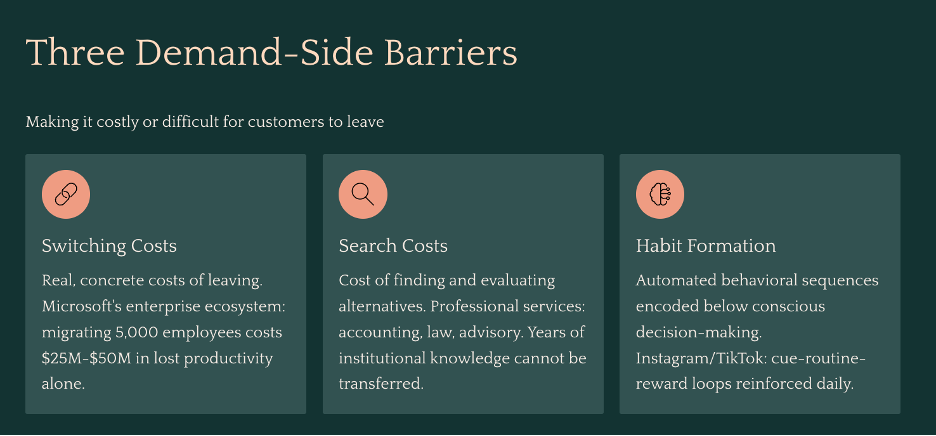
The Cost of Switching
The most direct demand-side barrier is when leaving you imposes a real, concrete cost on the customer — one large enough that a competitor’s pricing or feature advantage cannot rationally justify bearing it.
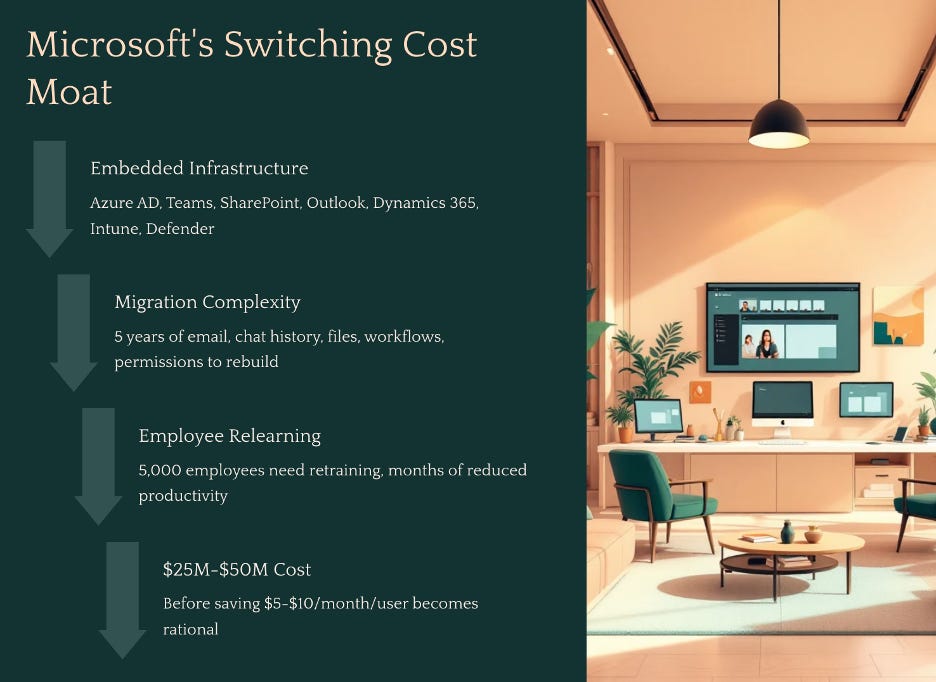
The clearest example in the world today is Microsoft’s enterprise ecosystem. Picture a company of 5,000 employees. Over the past decade, they have built their entire operational infrastructure on Microsoft’s stack. Every employee logs in through Azure Active Directory, the identity management system that serves as the digital front door to every application in the company. Their communication runs on Teams — years of chat history, meeting recordings, project channels, and file threads. Their files live in SharePoint, which the operations team has spent years organising into department-specific sites, permission structures, and workflows. Their email — including institutional correspondence, compliance archives, and client history — runs on Outlook through Exchange. Sales and customer data runs on Dynamics 365. Security policy, device management, and compliance monitoring runs through Microsoft Intune and Microsoft Defender, configured over years to match the company’s specific legal and regulatory requirements.
Now a competitor — say, Google Workspace — approaches with a compelling pitch. Better collaboration tools. Competitive pricing. Modern interface.
The IT director does not evaluate this as a features comparison. They evaluate it as a risk and cost assessment. To switch, the company would need to migrate five years of email history from Exchange to Gmail — not just the emails, but the rules, the shared mailboxes, the calendar integrations. They would need to rebuild every SharePoint site in Google’s equivalent tools, recreating the permissions structure, the workflows, and the institutional organisation that hundreds of employees built over years. They would need to replace Azure Active Directory as the identity layer — which means reconfiguring the sign-on credentials of every third-party application in the company that currently authenticates through Microsoft. They would need to retire Teams and migrate to Google Meet, accepting the permanent loss of all chat history, all meeting recordings, and the entire thread of internal institutional memory that lives in those channels. And for each of the 5,000 employees, they would need to fund retraining: not just a one-hour tutorial, but the weeks of reduced productivity and the months of re-establishing habitual fluency that comes with a platform transition.
Before a single consulting fee has been paid, the estimate typically runs between $5,000 and $10,000 per employee in lost productivity, training cost, and project management overhead alone. For a 5,000-person company, that is $25 million to $50 million — and 12 to 18 months of organizational disruption — in exchange for saving perhaps $5 to $10 per user per month in licensing fees. The math does not work. It almost never works. And Microsoft knows this, which is why the pricing strategy for Microsoft 365 is not to be the cheapest option. It is to be embedded deeply enough that the cost of evaluating alternatives is itself prohibitive, long before the cost of actually switching is even reached.
This is what switching cost looks like as a structural moat. The product does not need to win on features every year. It simply needs to ensure that the cost of replacing it grows faster than any competitor’s ability to offer a reason to bear it.
The Cost of Searching
The second demand-side barrier is less discussed but equally powerful in the right context: the cost to the customer of finding and evaluating an alternative, independent of the cost of switching to it.
This barrier is most naturally present in services — and understanding why helps clarify where to look for it.
When you buy a physical product, you can evaluate it before committing. You can read reviews from thousands of prior customers, examine the specifications, return it if it fails to deliver. The information required to make a confident purchase decision is largely available before you spend a dollar.
Services are fundamentally different. A service is, by nature, intangible and experienced only after the relationship begins. More importantly, the quality of most services depends on context that is specific to you: the lawyer needs to know your case history, the accountant needs to know your business structure and tax position, the financial advisor needs to know your risk tolerance and long-term goals, the IT support provider needs to know your systems architecture. This institutional knowledge cannot be transferred completely to a new provider — it must be rebuilt, imperfectly and over time, at the new provider’s learning curve and at your expense.
Consider a mid-sized business that has worked with the same accounting firm for eight years. The firm knows the nuances of the business’s industry, the history of every tax position ever taken, the relationships with local tax authorities, and the particular sensitivities of the founders’ personal and corporate finances. To switch firms, the business does not simply find a new accountant and hand over a spreadsheet. They spend months transferring institutional context that can never be fully conveyed. They pay the new firm to learn what the old firm already knows — at full billing rates during the learning period. And they accept a period of elevated risk: the new firm, unfamiliar with the specifics of the business, is more likely to miss something in year one than the incumbent who has seen eight years of the business’s full picture.
The search cost here is not just the effort of finding an alternative. It is the cost of the information asymmetry the customer cannot resolve before committing. You cannot know whether the new firm is as good as the incumbent until you have already been inside the relationship for a year or more. A competitor could be genuinely superior on every measurable dimension and the rational customer would still require a very compelling reason to absorb the evaluation risk.
This is why professional services firms — accounting, law, insurance brokerage, medical practices, financial advisory — often retain clients for decades with minimal active effort to retain them. The cost of searching for and validating an alternative is simply high enough that departure requires an extraordinary catalyst. A minor service improvement from a competitor does not clear that bar. The incumbent collects the revenue of a deeply embedded relationship while a new entrant must offer a step-change in value just to get the customer to begin an evaluation.
Habit
The third demand-side barrier is the deepest, because it operates entirely below the level of conscious decision-making. When a habit is fully formed, the customer is not choosing your product each time they reach for it. They are executing an automated behavioral sequence that was encoded years earlier and now runs without deliberation.
The psychology behind this was formalised by behavioural researcher Charles Duhigg, drawing on decades of neuroscientific work: habits form through a three-part loop. A cue in the environment triggers a routine, and a reward follows. Repeat the loop enough times in enough contexts, and the brain internalises the routine as the automatic response to the cue. The decision is, in the most literal neurological sense, removed from conscious consideration. The cue appears. The behaviour fires.
Coca-Cola is the most thoroughly studied example of a brand that engineered this loop at a civilisational scale — and it is examined in detail in the company case study. But the mechanism is not unique to consumer beverages. A second example makes the psychological machinery visible in a completely different context.
Consider what happens when you open Instagram or TikTok. You pick up your phone during a moment of downtime — standing in a queue, lying in bed before sleep, waiting for a meeting to start — and within seconds you are scrolling. You did not make a decision to scroll. You responded to a cue (boredom, idle hands, a moment of transition) with a routine (open the app, begin scrolling) that produces a reward. The reward, critically, is variable. Sometimes you scroll past ten unremarkable posts and find nothing. Sometimes the next post is something that makes you laugh, or feel something, or discover something you wanted to know. You never know when the reward will arrive. That unpredictability is not a design flaw. It is the engine.
B.F. Skinner, the behavioural psychologist, demonstrated this decades before smartphones existed. In his experiments, he placed rats in a chamber with a lever. One group of rats found a food pellet every time they pressed the lever — consistent reward. Another group found a pellet unpredictably — sometimes after one press, sometimes after ten, sometimes after fifty. The second group pressed the lever far more frequently, far more persistently, and far more compulsively than the first. Predictable rewards produce moderate, manageable behavior. Variable rewards produce compulsive, difficult-to-extinguish behavior.
The red notification badge on a social media app is a manufactured cue built on exactly this principle. Every time you see it, the brain anticipates a variable reward — a like, a comment, a message, something interesting — and fires the routine before conscious deliberation has a chance to intervene. The app has engineered the cue-routine-reward loop to run automatically, at high frequency, across dozens of daily moments. The habit does not require the app to be the best app. It requires the loop to have been established early and reinforced often enough that the brain treats it as the default response to a set of triggers that occur dozens of times every day.
For a competitor seeking to displace a habituated user, the challenge is not building a better product. It is producing something compelling enough to override an automated behavioral response, consistently, across every context in which the trigger fires, for long enough that the new behavior becomes the new habit. That is an extraordinarily high bar. Most competitors never clear it, and the ones who do typically achieve it only by exploiting a paradigm shift large enough to make the existing habit context-inappropriate — the way smartphones made the desktop browser habit irrelevant for most daily use cases.
The Supply Side: Three Reasons Competitors Cannot Replicate You
Supply-side barriers work differently. Instead of making it hard for customers to leave, they make it structurally difficult or impossible for competitors to build what you have built — even with the capital, talent, and determination to try.
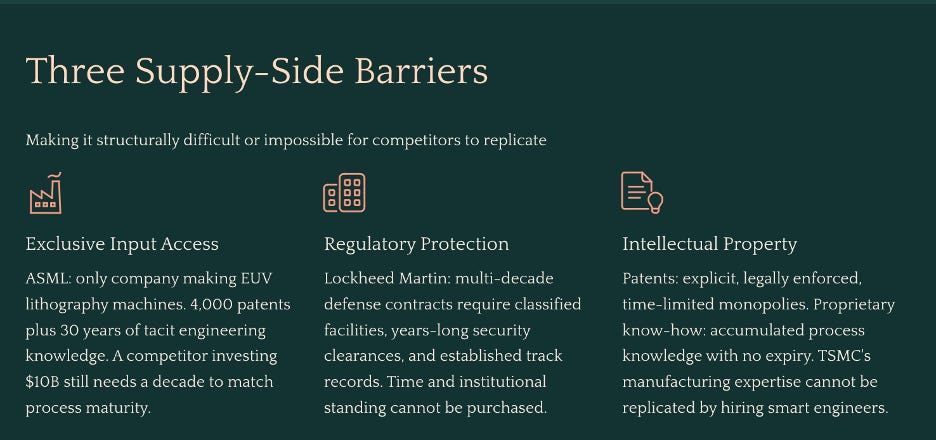
Access to Inputs — Either Exclusively or at a Cost Others Cannot Match
The most direct supply-side advantage is controlling something a competitor needs but cannot acquire at equivalent cost or at all.
The most striking example in modern industry is ASML, the Dutch company that manufactures the extreme ultraviolet lithography machines required to produce the world’s most advanced semiconductors. ASML is the only company on earth that can build these machines. The barriers are not primarily financial — a well-capitalised competitor could theoretically attempt to build a rival programme. The barriers are structural: ASML holds over 4,000 patents directly related to EUV lithography, and those patents protect only the parts of the process that can be disclosed. Beneath the patents sits three decades of accumulated engineering knowledge — the specific mirror coatings, the plasma source chemistry, the vibration isolation techniques, the yield optimisation protocols — that exist in the institutional memory of the company’s engineers and the tacit knowledge embedded in its production processes. A competitor could hire a team of brilliant optical engineers, invest $10 billion, read every ASML patent, and still spend a decade arriving at process maturity that ASML achieved through 30 years of continuous refinement. The knowledge cannot be transferred by acquisition or reverse-engineered from the product. It can only be built through time, and time is exactly what a competitor does not have.
A simpler but equally vivid version of exclusive access is geographic: a Grand Cru vineyard in Burgundy, France. The wine produced from a specific plot in Romanée-Conti sells for thousands of dollars a bottle because the specific combination of soil composition, drainage, microclimate, and centuries of agricultural understanding that produces the wine exists in that precise plot of land and nowhere else on earth. A competitor with unlimited capital cannot replicate the supply. They cannot move the soil. They cannot recreate the microclimate. They can purchase an adjacent plot, but the terroir is not transferable. The supply advantage is, in the most literal sense, geographically exclusive.
Government Relationships and Contracts
Regulatory protection and established government relationships are a supply-side barrier that most investment frameworks underappreciate, partly because they are slow to develop and invisible until they are tested.
Lockheed Martin’s position in US defence contracting illustrates the mechanism. To compete for a major military aircraft programme — the kind of multi-decade contract that involves classified systems integration, crew safety certification, and national security infrastructure — a new entrant would need to build and maintain facilities certified for handling classified information, employ personnel who have individually undergone extensive government security clearance processes that take years and cannot be accelerated, establish a performance track record with defence procurement agencies through smaller contracts before being trusted with larger ones, and navigate a procurement system that is, by design, biased toward established contractors because the political and operational consequences of contractor failure in defence are catastrophic in ways that failure in a commercial context is not. A Senator whose district contains a Lockheed facility and whose constituents’ employment depends on a programme is not a neutral evaluator of whether a new entrant deserves consideration.
None of this is corruption or impropriety. It is the natural consequence of operating in a domain where trust is built over decades, verified through regulatory frameworks that take years to navigate, and grounded in a track record that new entrants structurally cannot possess. The barrier to entry is not capital. It is time and institutional standing, and those are not available for purchase at any price.
Patents and Proprietary Know-How
Patents and proprietary know-how are supply-side barriers of different character and duration, and distinguishing between them matters for how long you expect the protection to last.
A patent is explicit, legally enforced, and time-limited. It grants the holder a monopoly on a specific innovation for a defined period — typically 20 years — after which it enters the public domain. The value of a patent-based moat is therefore calculable and finite. This is precisely the circumstance in which the PE duration table discussed in Part One becomes a precision instrument rather than a directional guide: count the years until expiry, map them against the earnings growth rate, and assess whether the current valuation is justified by the duration that remains. The certainty cuts in both directions — a business with a moat that expires in three years is a business with three more years of protected earnings, and the market should price it accordingly.
Proprietary know-how is altogether different, and most of the time, better. It is not registered, not legally enforced, and has no defined expiry date. It exists in the accumulated process knowledge, manufacturing expertise, material science understanding, and institutional memory that a company builds over years of doing something at scale. Intel’s sustained struggle to match TSMC’s semiconductor manufacturing yields, despite having world-class engineering talent and decades of experience, illustrates the point: the process knowledge embedded in TSMC’s factories is not something that can be replicated by hiring smart engineers or studying published research. It lives in the specific sequence of decisions, optimisations, and hard-won failure modes that a manufacturing organisation has navigated over 30 years of running these processes continuously. That knowledge, in the most literal sense, cannot be transferred. It can only be accumulated through time, and no amount of capital investment shortens the timeline.
Economies of Scale: The Third Force, and Why It Is Always Local
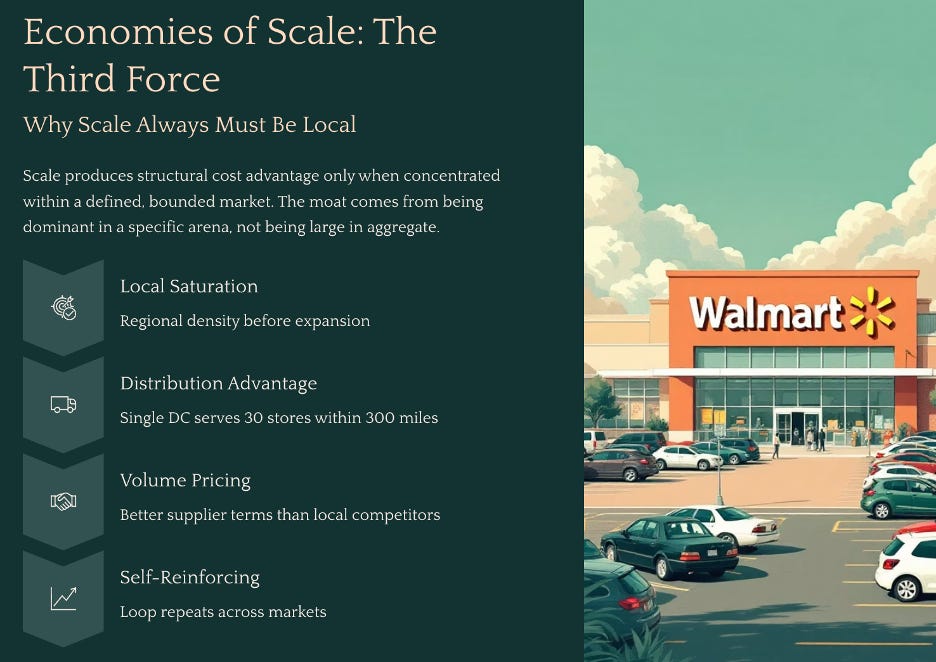
Economies of scale are the most frequently cited and most widely misunderstood source of competitive advantage. The mistake is treating scale as a general property — assuming that being bigger confers a cost advantage over smaller competitors simply by virtue of size. A large company with $50 billion in revenue can be disrupted just as decisively as a small one if the underlying economics of the market are contestable. Scale produces a structural cost advantage only in a specific condition: when that scale is concentrated within a defined, bounded market — a geography, a customer segment, a distribution channel — and the cost structure that results from dominating that bounded market cannot be replicated by any competitor without first winning the market share that nobody will hand them.
This is the insight that most scale-based analyses miss entirely. The moat does not come from being large in the aggregate. It comes from being dominant in a specific arena, and then using the economic advantages that dominance produces to make that dominance self-reinforcing before expanding to the next arena. The sequence matters as much as the outcome.
Walmart is the clearest possible demonstration of this dynamic — but only if you understand where Walmart actually started.
In 1962, Sam Walton opened his first Walmart in Rogers, Arkansas. Not in New York. Not in Chicago. In a small town of roughly 5,000 people in northwest Arkansas, a market that every other major retailer had looked at and passed on as too small to justify the investment. Walton’s thesis was precisely the opposite: small towns were underserved, customers in those markets had fewer alternatives, and a retailer who dominated a cluster of small towns in a single region could build the local scale to negotiate better supplier terms than the general stores and small-town retailers who currently served those customers — without ever having to go head-to-head with Sears or Kmart in the large markets where those competitors were entrenched.
For the first decade, Walmart barely left Arkansas. By the early 1970s, Walton had opened stores in a tight cluster across Arkansas and the immediately adjacent corners of Missouri and Oklahoma — a radius of roughly 300 miles from his original store. This geographic concentration was not accidental and it was not a failure to grow faster. It was the strategy. By saturating a specific region before moving on, Walmart built something that a retailer spread thinly across a national footprint could not: regional distribution density. A single distribution centre in Arkansas could serve 30 stores within a few hours’ drive, which meant lower logistics costs per store, faster restocking, and less inventory waste than a competitor running stores so dispersed that each required its own supply chain infrastructure. The regional density was itself a supply-side advantage, and it was only achievable because Walton chose depth over breadth in the early years.
This regional dominance also meant that Walmart’s purchasing volume — while modest at a national level in the 1960s — was large enough relative to the suppliers serving those specific markets to secure meaningfully better pricing than any of the local competitors could. A general store in a small Arkansas town buying a hundred hammers a year had no leverage over a hardware supplier. Walmart buying for thirty stores in the same region had considerably more. The scale advantage was local and bounded, but within those bounds it was real and compounding.
Now watch what happened when those early advantages — regional distribution density and volume-based supplier pricing — were applied to the demand side in each new town Walmart entered.
Before Walmart arrived, a typical small town had its needs served by a collection of independent local retailers: a hardware store, a grocery, a pharmacy, a clothing shop. Each had a local monopoly in its category. Customers knew these stores well, had been shopping there for years, and faced enough search cost and ingrained habit that switching to an alternative — even if one existed — simply was not worth the disruption for routine purchases. The friction of replacement was modest but sufficient. It had sustained healthy margins for these businesses for decades.
Walmart arrived with a supply-side cost structure that none of them could match. Because Walmart’s regional purchasing volume allowed it to negotiate lower input costs than any single-category local retailer, it could price below what those retailers needed to charge just to cover their own cost of goods. The local hardware store was not losing to a better-run hardware store. It was losing to a competitor whose cost of goods was structurally lower before either of them opened their doors each morning.
Those lower prices triggered something on the demand side. A family that previously made separate trips to the hardware store, the grocery, and the pharmacy began consolidating into a single Walmart visit — not just because the prices were lower, but because the convenience of one stop replaced the search cost and time cost of three. As that consolidated shopping trip repeated across weeks and months, the behavior began to encode itself as habit. The cue — the shopping list, the errand — now automatically produced the Walmart trip as the routine response. Each repetition deepened the groove. The local specialty stores, stripped of foot traffic, faced declining revenue. Declining revenue meant even less purchasing volume, which meant worse supplier terms, which meant thinner margins, which meant either higher prices or reduced inventory — neither of which helped compete against a lower-priced, better-stocked alternative that customers were already habituated to. Most closed within a few years.
Once the local competitors were gone, a new entrant trying to open a competing general retailer in that town faced an economy that had been reshaped entirely around Walmart’s economics. To match Walmart’s prices, the new entrant needs Walmart’s supplier terms. To get Walmart’s supplier terms, it needs Walmart’s purchasing volume. To achieve Walmart’s purchasing volume, it needs to win customers away from a store those customers have been using habitually for years. To win those customers, it needs to offer lower prices or a dramatically better experience — but it cannot offer lower prices because its input costs are structurally higher, and a better experience alone is not compelling enough to break a well-established routine.
The loop is closed. The supply-side cost advantage funded the price leadership that built the demand-side habit. The habit eliminated the competition. The elimination of competition locked the volume advantage permanently within that geography. And the locked volume continued compounding Walmart’s supplier leverage as it replicated the same playbook — local saturation first, regional density second, national expansion third — in market after market across the country.
This sequencing is the part that most analyses of Walmart’s success overlook. The national scale that Walmart eventually achieved was not what created the moat. It was the aggregate result of hundreds of individually won local markets, each of which had been approached with the same strategy: build regional density to the point where the supply-side and demand-side advantages start feeding each other, let the loop run until the local competition is gone, and then move to the next cluster. The moat at the national level is formidable precisely because it was built local-first, one bounded market at a time, in a way that made each individual market self-sealing before the next was attempted.
The general principle the Walmart story illustrates — and the reason it belongs in a framework built around barriers to entry — is that economies of scale become a genuine moat only when they produce a combination of supply-side cost advantage and demand-side captivity within a specific, bounded arena, and when achieving that combination takes long enough that any competitor arriving later must absorb years of structural losses just to reach the starting line. Being large in the abstract is not a moat. Being dominant in a specific place, in a way that took years to build and that the economics of the market make nearly impossible to replicate — that is.
Strong Today Is Not the Same as Durable
Before the moat analysis is complete, there is one distinction that determines whether you are building a ten-year thesis or a thirty-year one — and it is the distinction that most structural analysis either skips or treats as an afterthought.
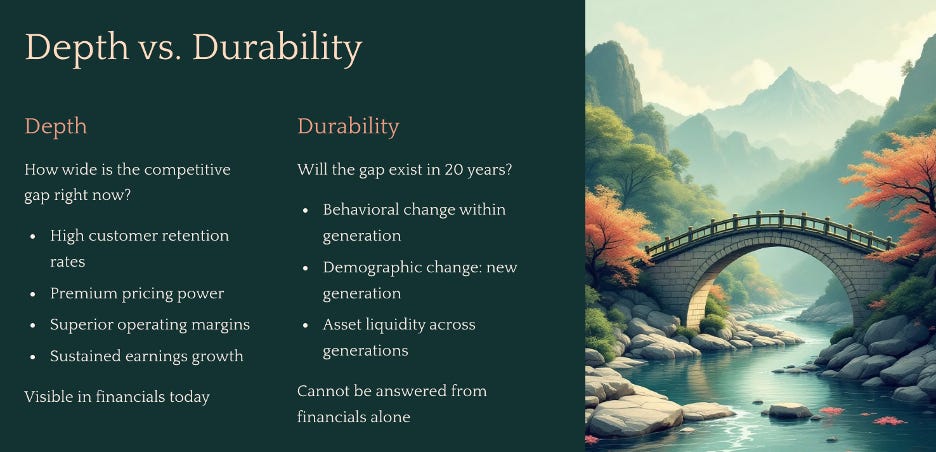
Depth describes how wide the competitive gap is right now. A business with genuinely high switching costs retains customers at high rates and commands premium pricing. A business with exclusive supply advantages sources inputs at costs competitors cannot match, producing structurally superior operating margins. A business with dominant scale within a bounded market has a per-unit cost structure that no smaller competitor can approach. Depth is visible in the financials — in the Cash Reinvestment Rate, the return on equity, the operating margins relative to the industry, and the earnings growth rate sustained over time. Depth tells you how strong the moat is today.
Durability asks whether the same gap will still exist in 20 years. And that question cannot be answered from the financial statements, because the financials only reflect what has already happened. Durability depends on whether the assets that create the moat today are adaptable to the behavioral and demographic changes that will arrive over the holding period — changes that are inevitable in some form, even when their specific direction is impossible to predict.
These are two entirely separate assessments, and confusing them is one of the most expensive analytical mistakes an investor can make.
Why Strong Moats Fail: The Two Threats to Durability
A moat erodes through two distinct channels, and understanding both matters because each one requires a different kind of vigilance.
The first is behavioral change within a generation. The same customers stop doing something the way they used to. They do not disappear, and the underlying need does not go away — they simply begin satisfying it differently. When this happens, the question is whether the asset that served the old behavior can serve the new one.
The second is demographic change — a new generation arrives having never formed the habit in the first place. This is more permanent than behavioral change, because there is no existing relationship to migrate and no habit to redirect. The business must earn the new demographic from scratch, competing against whatever captured that generation’s attention during the years when habits were forming. By the time the shift is large enough to appear in the financials, that window has usually already closed.
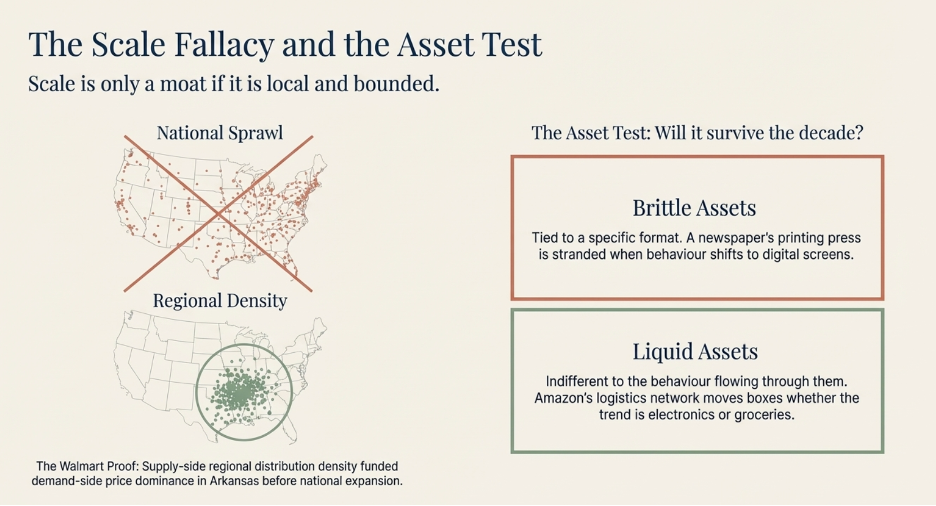
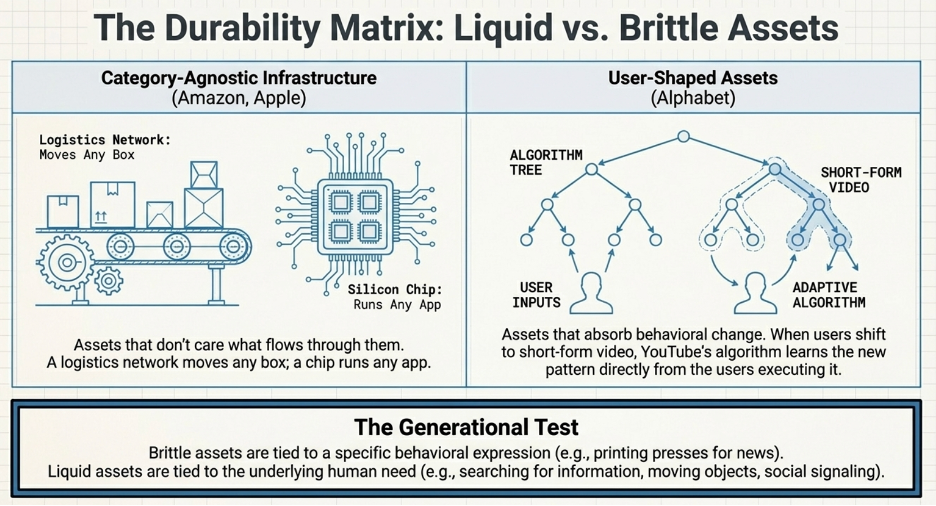
The regional newspaper failed through both channels at once. Existing readers migrated to digital screens. Each new generation arrived without ever forming the morning paper ritual. The classified advertising network transferred to free platforms. The readers did not stop wanting news. The advertisers did not stop wanting to reach buyers. But the assets — printing infrastructure, physical distribution, a newsroom built around daily print cycles — were so specifically tied to the physical format that none of them could serve those needs in the new form they took. The format changed. The assets could not follow.
The Holy Grail: What Makes an Asset Liquid Across Generations
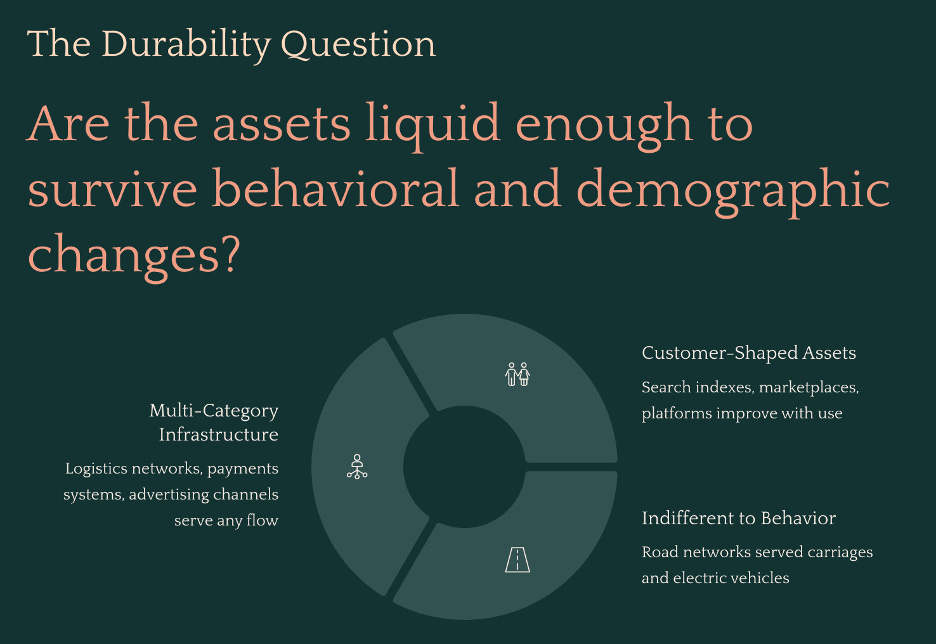
The question that determines whether a moat is worth holding for a decade or three decades is not “is this moat strong today?” It is: are the assets that create this moat liquid enough to survive the behavioral and demographic changes that will arrive over the holding period?
A liquid asset is one that serves a fundamental underlying need — or is shaped directly by customers themselves — such that changes in how people satisfy that need route through the same asset rather than past it. A brittle asset is one tied so specifically to one behavioral expression of a need that when the expression changes, the asset becomes irrelevant.
The road network is the most durable illustration of a liquid asset in history. The infrastructure built for horse-drawn carriages in the 19th century now carries electric vehicles, autonomous delivery robots, and long-haul freight. The builders anticipated none of these use cases. It did not matter, because the underlying need the road serves — moving people and goods through physical space — has not changed and will not change. Every behavioral shift in transportation technology has routed through the same physical infrastructure in a new form. The asset is indifferent to the behavior built on top of it, because the behavior changes but the fundamental need does not.
Two types of assets reliably exhibit this property.
The first type serves the general population across multiple categories and behavioral contexts. A logistics network, a payments infrastructure, an advertising distribution channel — these assets are indifferent to what flows through them. Amazon’s fulfillment network moves boxes. It does not know or care what is inside them. A shift from electronics to groceries to pharmaceuticals does not require the network to be rebuilt. It requires the network to handle a new category of object, which the infrastructure is already designed to do. Walmart does the same. It does not care if customers are shopping physically or following the e-commerce trend. The behavioral shift simply gives the asset new things to do.
The second type is assets that are shaped by customers themselves through their use of it. A search index that improves with every query. A marketplace that becomes more valuable with every transaction. A social platform that becomes more relevant with every post. These assets do not just survive behavioral change — they absorb it, because the people driving the change are the same people contributing to the asset. When consumer behavior shifts toward a new content format, YouTube’s recommendation engine learns the new format from the consumption patterns of the users migrating toward it. The asset reshapes itself in the direction of behavioral change because the users reshaping their behavior are simultaneously reshaping the asset.
The durability question, applied to every business in this paper, is therefore: when consumer behavior shifts in ways we cannot precisely predict, does the asset that creates this moat move with the shift or get stranded by it? The cases that follow examine each business against this test — not to confirm a foregone conclusion, but to identify precisely where the edges of each moat’s durability sit, because those edges define the conditions under which the long-term thesis breaks.
Part Three: Identifying the High-Growth Compounder
Start With the Most Basic Truth in Business
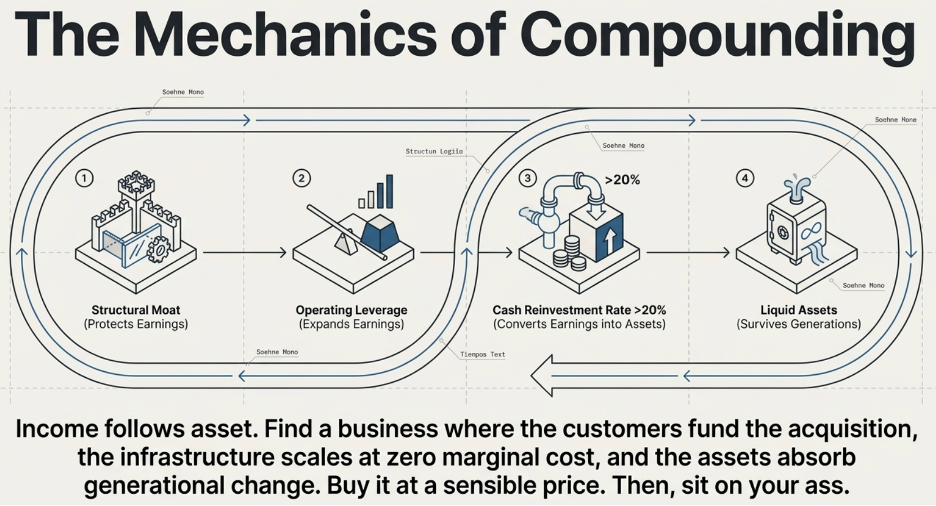
Before even thinking about a spreadsheet, there is a first-principles observation that almost every model eventually obscures: a business earns money because it has productive assets to earn it from. Income follows asset. Always. No exceptions.
A property generates rental. A factory generates income because it converts raw materials into products customers pay for. A software platform generates income because it has a codebase, a customer base, and the infrastructure to serve them. A brand generates income because it commands pricing power with customers who trust it. Strip away the accounting and the complexity, and every dollar of revenue a business earns traces back to a productive asset that made the earning possible. No asset, no income. More productive asset, more income.
This is not a novel insight. It is simply the foundational economic reality that most financial analysis works several layers above, dealing with revenue growth rates, earnings multiples, and margin trends without ever returning to the underlying mechanism. But when you hold the principle clearly — income follows asset — it changes the question you ask about a business. Not “how much did it earn last year?” but “how fast is its productive asset base growing, and how efficiently is each new asset being deployed?” Because those two answers will tell you, more precisely than almost any other metric, how fast the income can compound from here.
The Reinvestment Engine
Now follow the logic one step further.
If income follows asset, and a business earns income every year, then the critical variable is what happens to that income once it is earned. The business faces a choice: return the income to shareholders as dividends, or reinvest it into more productive assets. If it reinvests, the asset base grows. A larger asset base produces more income next year. That income can be reinvested again into more productive assets. Each cycle, the productive base expands, and the income expands with it.
This is compounding — not as a financial abstraction, but as the literal mechanics of how a business’s income-generating engine gets larger over time. And the speed at which this compounding runs depends on two things: how much of the income is reinvested, and how productive each dollar of reinvestment is. A business that reinvests 10 cents of every earned dollar builds its asset base far more slowly than one that reinvests 50 cents. And a business that generates $2 of future income from every $1 reinvested compounds far faster than one that generates $1.10.
The question for an investor evaluating a potential long-term holding is therefore simple to state and demanding to answer: how efficiently is this business converting its current earnings into productive assets that will generate future earnings? What is the reinvestment rate, and what is the quality of that reinvestment?
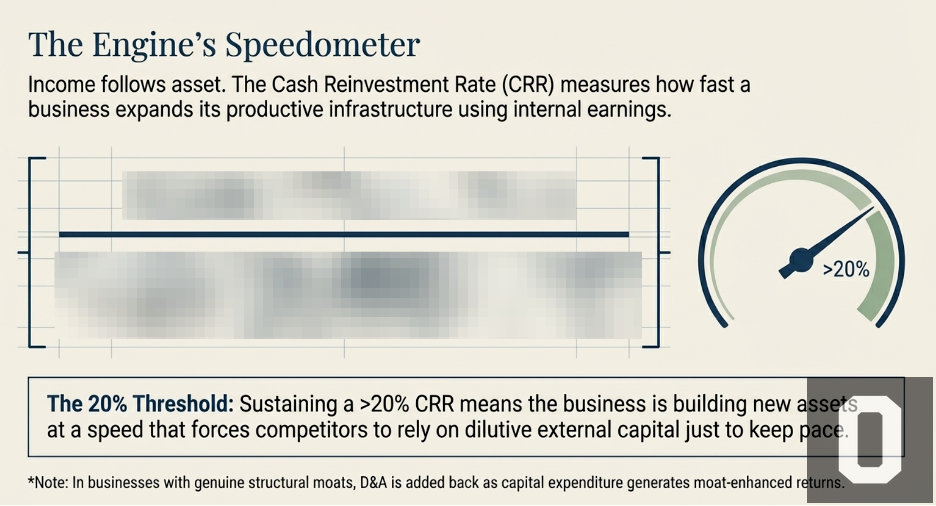
This is precisely what the Cash Reinvestment Rate measures.
The Cash Reinvestment Rate: The Engine’s Speedometer
The CRR is calculated as follows:
[To be revealed in subsequent writings]
The numerator is the earnings available for reinvestment. The denominator is the total productive asset base — the accumulated result of every reinvestment decision the company has ever made, expressed as the capital currently deployed in the business.
Dividing one by the other gives you the rate at which the business is rebuilding and expanding its own productive infrastructure from a single year’s earnings.
A CRR of 20% means that in a given year, the business is adding productive assets equivalent to 20% of its existing deployed capital base — funded entirely from that year’s earnings, with no external capital required. Sustained over ten years, that is a business more than doubling its productive asset base from internal earnings alone, without issuing shares or taking on debt. The compounding is entirely self-funded.
The D&A adjustment deserves a careful note because it is conditional, not universal. This finding was made when I did an analysis on Amazon. Depreciation and amortisation are accounting charges that reduce reported operating income but do not represent cash leaving the business. In a business without a durable moat — one where new capital investment simply replaces ageing assets at replacement cost — depreciation is a real economic cost and adding it back would overstate the earnings available for genuine growth. But in a business with a strong structural moat, new capital investment generates returns that far exceed the replacement cost it is nominally categorised under. A new Amazon fulfilment centre, built on top of Amazon’s existing logistics infrastructure, brand equity, and Prime membership base, does not earn a replacement-cost return. It earns a moat-enhanced return. In those cases, adding back D&A gives a more accurate picture of the true earnings power available for compounding. This is why the qualitative moat analysis in Part Two is not a parallel exercise — it is a prerequisite. Without it, you cannot correctly calibrate the metric you use to validate it.
Why 20% Is the Threshold
The 20% threshold is not arbitrary. It is the level above which the productive asset base compounds faster than most well-capitalised competitors can match through any combination of borrowing, equity issuance, or operational improvement.
Think about what it means for the competitive gap over time. A business with a 20% CRR is building new productive assets — new customer relationships, deeper technology moats, denser distribution infrastructure, richer institutional knowledge — at a rate that requires a competitor to inject substantial external capital just to keep pace. If a competing business generates a 10% CRR and must raise the remaining 10% through debt or equity issuance to match the growth, its cost of expansion is structurally higher. It pays interest or dilutes shareholders to match what the better-moated business finances from internal earnings at no dilutive cost. Over five years, the gap between these two businesses is not a rounding error. It is a compounding structural divergence that widens every year the conditions persist.
A rising CRR over the holding period is the financial signature of a moat that is working. It means the business is generating progressively more earnings per dollar of deployed assets — the competitive advantage is deepening, not eroding, and the compounding engine is running faster rather than slowing. When the CRR begins to contract, it is the earliest quantitative signal that something structural may be changing — competition is intensifying, reinvestment opportunities are becoming less productive, or the moat is narrowing. The qualitative thesis and the CRR should be telling the same story. When they diverge, the divergence is the most important question to answer.
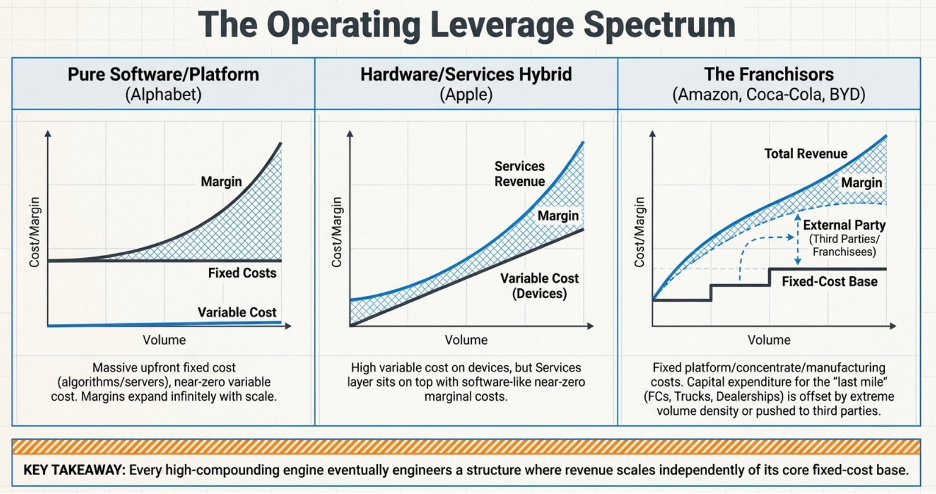
Operating Leverage: The Mechanism That Makes the CRR Accelerate
To understand why operating leverage is the defining characteristic of the highest-compounding businesses in the world, start with a simple question you can ask about any business: for every new customer you acquire, how much more does it cost you to serve them?
That question — how much of your cost structure grows with your customer base versus how much stays fixed regardless of how many customers you have — determines almost everything about how profitable a business becomes as it scales.
Two Businesses, One Fundamental Difference
Consider two businesses side by side:
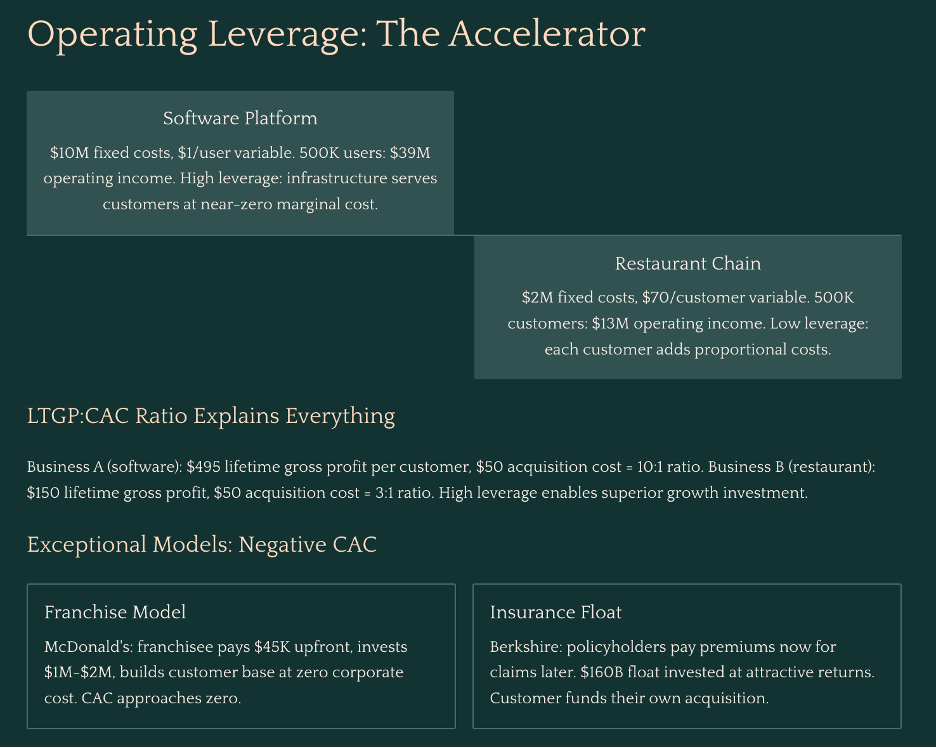
Business A is a software platform. Once the code is written and the servers are running, adding one more user costs almost nothing — roughly $1 per customer per year in incremental infrastructure. Its fixed costs — the engineering team, the servers, the security systems — run $10 million per year whether it has ten customers or ten million.
Business B is a restaurant chain. Every additional customer requires food, kitchen labour, and table service. Its variable cost is $70 per customer per year. Its fixed costs — leases, base kitchen staff, management — are $2 million per year.
Now watch what happens as both businesses grow from 100,000 customers to 500,000.
At 100,000 customers, Business A generates $10 million in revenue against $10 million in fixed costs and $100,000 in variable costs. It is barely breaking even. Business B, meanwhile, generates $10 million in revenue against $9 million in total costs, producing $1 million in operating income. At this early stage, Business B looks like the better business.
At 500,000 customers, the picture reverses dramatically. Business A generates $50 million in revenue. Its fixed costs have barely moved — call it $10.5 million with some modest team additions. Variable costs are $500,000. Operating income: $39 million. Business B also generates $50 million in revenue, but its variable costs have grown to $35 million, giving total costs of $37 million. Operating income: $13 million.
Revenue grew five times for both businesses. Business B’s operating income grew thirteen times — a strong result by any measure. Business A’s operating income grew from near zero to $39 million. The gap is not explained by better management or a stronger product. It is explained entirely by cost structure. Business B will always spend $70 to serve a customer who pays $100. Its margin is permanently capped at $30 per customer regardless of how large it becomes. Business A spends $1 to serve a customer who pays $100, and that $1 does not materially change whether there are 100,000 customers or 5 million. Every new customer is almost pure profit layered on top of a fixed cost base that was already paid.
This is what high operating leverage means in practice: a cost structure where the hard, expensive work of building the business is done once upfront, and every customer acquired after that generates disproportionate profit because the infrastructure that serves them already exists.
What This Means for Each Customer Relationship
Operating leverage does not just change how profitable a business becomes in aggregate. It changes the economics of each individual customer relationship — and those unit economics are what determine how aggressively a business can afford to grow.
This is where the LTGP:CAC ratio becomes the right lens. Lifetime Gross Profit, or LTGP, is the total gross profit generated by a single customer across the entire duration of their relationship with the business. Customer Acquisition Cost, or CAC, is what it cost to bring them in. The ratio of LTGP to CAC tells you how efficiently the business converts its growth spend into long-term profit.
In Business B, the gross profit per customer per year is $30 — the $100 in revenue minus the $70 variable cost. Over a five-year relationship, LTGP is $150. CAC is $50. The ratio is 3:1. For every dollar spent acquiring a customer, the business earns three dollars of gross profit over that customer’s lifetime.
In Business A, the gross profit per customer per year is $99 — the $100 in revenue minus the $1 variable cost. Over the same five years, LTGP is $495. CAC is still $50. The ratio is just under 10:1. For every dollar spent acquiring a customer, the business earns nearly ten dollars of gross profit.
The practical consequence of this gap is significant. Business A can rationally justify spending far more to acquire each customer than Business B, because the return on that spend is so much higher. If both businesses are competing for the same customer through the same advertising channel, Business A can outbid Business B and still come out ahead. Business A can invest more in product quality to reduce churn. It can offer a better onboarding experience. It can subsidise trials and promotions. All of this is economically rational precisely because the high operating leverage structure ensures the eventual payoff per customer is large enough to absorb a higher upfront cost. The high-leverage business becomes a structurally superior competitor for customers — not because of its product alone, but because its economics allow it to invest in growth at a rate its lower-leverage competitor simply cannot match without destroying its margins.
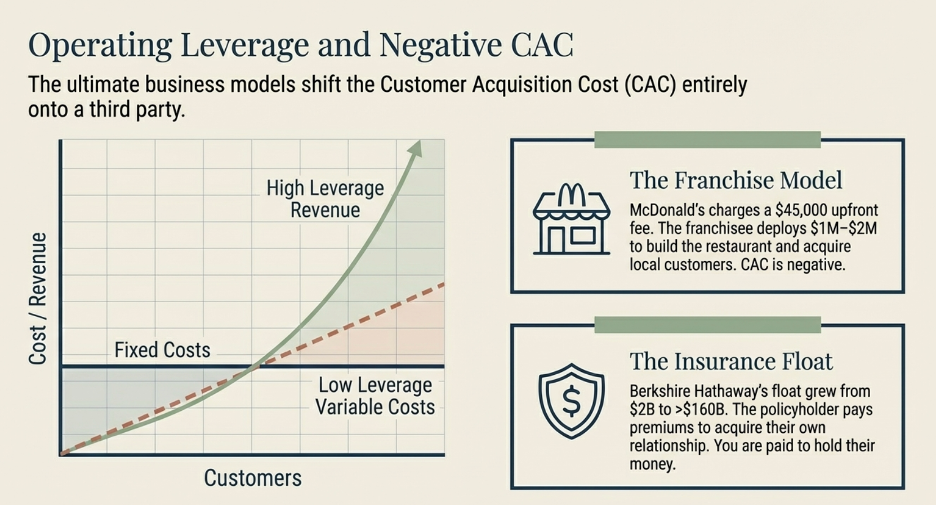
But here is where the most exceptional businesses diverge from even Business A. The businesses with the highest LTGP:CAC ratios in the world are not simply efficient at acquiring customers. They have engineered their model so that the cost of acquiring customers approaches zero — or turns negative entirely, meaning the growth of the business is funded by others rather than by the business itself. Two business models achieve this in different ways, and each one is worth understanding on its own terms before seeing how they all arrive at the same conclusion.
The Franchise Model: Getting Paid to Grow
A conventional business acquires customers by spending money. Advertising budgets, salespeople, promotions, discounts — every new customer costs something to bring in. The franchise model does something structurally different: it shifts the entire cost of building and acquiring customers onto the franchisee.
When McDonald’s grants a franchise, the franchisee pays an upfront fee of roughly $45,000, commits to ongoing royalties of 4 to 5% of gross revenue, and then invests their own capital — typically $1 million to $2 million — to build the restaurant, hire and train staff, and develop the local customer base. They run local marketing. They handle all operations. They bear all the execution risk of whether the location performs.
From McDonald’s corporate perspective, every new franchise location that opens represents a new pool of customers being built and served at zero cost to McDonald’s. The franchisee did the work. The franchisee took the risk. And McDonald’s collects a royalty on every dollar of revenue those efforts generate for as long as the location operates.
The CAC for McDonald’s is therefore not just low — it is negative. McDonald’s is paid, upfront, by the very operators who are building its customer base on its behalf. In LTGP:CAC terms, the denominator approaches zero and the ratio becomes effectively infinite: there is no acquisition cost to divide by because the acquisition process itself generates income.
The operating leverage on top of this is equally extreme. McDonald’s corporate revenues — royalties, franchise fees, and lease income — scale with the size of the network and same-store sales performance. Its fixed cost base, however, does not scale with those revenues in any meaningful way. Food costs, kitchen labour, utilities — all of it sits with the franchisee. McDonald’s adds revenue with each new restaurant and each percentage point of same-store sales growth without bearing any of the variable costs of serving the customers those restaurants serve. The margin expansion from each additional dollar of network revenue is as close to pure profit as any business model produces.
The Insurance Float: Negative CAC With a Second Income Stream
Insurance extends the negative-CAC concept one step further by adding a mechanism that has no direct equivalent in any other business model: the float.
When a policyholder pays a premium, they are paying today for protection against a future event that may or may not occur — a car accident, a fire, a medical procedure. The insurer collects that premium now and pays claims later, sometimes months later, sometimes years. In the intervening period, the premium sits with the insurer as investable capital. This pool of collected premiums not yet paid out as claims is the float.
The float is not the insurer’s money permanently. It will eventually leave as claims. But in aggregate, for a large insurer writing billions of dollars of new premiums each year, the float is effectively permanent: new premiums constantly replenish what paying claims removes, and the total pool stays large and grows as the book of business grows. Berkshire Hathaway’s insurance operations have carried a float that has grown from roughly $2 billion in 1985 to over $160 billion today. That capital did not cost Berkshire a dividend payment or an interest charge. It was provided by policyholders who paid premiums to be insured.
Warren Buffett described this property early and precisely: the float is an interest-free loan from policyholders that Berkshire can invest in equities and businesses for as long as the insurance operation remains viable. The policyholders funded Berkshire’s investment portfolio. Berkshire earned the returns.
The CAC dimension is what makes the insurance model structurally remarkable. The policyholder pays the insurer to acquire and maintain their own business relationship. Every renewal premium is the customer funding the continuation of the relationship rather than the insurer spending to retain them. In a well-run book with strong customer retention, the insurer’s marginal acquisition cost is genuinely negative: the renewal premium exceeds the administrative cost of maintaining the policy, meaning the existing customer is generating net positive cash flow simply by staying.
The combined ratio determines whether the underwriting operation is adding to this or subtracting from it. The combined ratio is claims paid plus operating expenses, divided by premiums earned. A combined ratio below 100% means the insurer collects more in premiums than it pays out in claims and expenses — the underwriting itself is profitable, independent of any investment return on the float. A combined ratio of 95% means that for every $100 of premium collected, $95 covers claims and costs, and $5 is pure underwriting profit. That $5 of underwriting profit sits on top of whatever return the insurer earns by investing the float in the meantime.
When both are running simultaneously — a sub-100% combined ratio producing underwriting profit, and a large and growing float invested at attractive returns — the economics are extraordinary. The policyholder is paying you to hold their money. You are earning an investment return on that money. And the underwriting operation is generating profit on top of the investment return. In LTGP:CAC terms, there is no CAC: the customer paid to be acquired. There is a large and growing asset base — the float — generating returns that belong entirely to the insurer. And there is underwriting profit on top of that. This is what allowed Berkshire to compound its equity at rates that seemed implausible for its size over multiple decades. The policyholders financed the engine. Berkshire ran it.
Bringing It Back to the CRR
The franchise and insurance models are not exceptions to the operating leverage framework. They are its most powerful expressions.
In each case, the expensive, difficult work — building the brand and operating system, creating the intellectual property, developing underwriting expertise — is done once. The revenue that flows from that foundation scales with the network, the licensing estate, or the float, none of which require proportional increases in the cost base. More importantly, in each case the cost of acquiring and serving customers is borne by someone other than the business itself: the franchisee or the policyholder.
This is why the CRR in these businesses can sustain levels that conventional business models structurally cannot reach. When the earnings available for reinvestment are not being consumed by the cost of acquiring the customers who generated them, a larger share of each year’s income is available to compound the productive asset base. The CRR accelerates not because the business is being managed more efficiently, but because the architecture of the model has removed the largest drag on the reinvestment pool — growth cost — from the business’s own balance sheet and placed it on the participants in the ecosystem.
When you find a business with this structure, a genuine moat, and management aligned with long-term value creation, what you have found is a compounding engine where the fuel is provided by others and the returns accumulate entirely to the owner. The case studies that follow are each an example of exactly that.
Part Four: The Companies
Apple — The Business That Gets Paid to Grow Itself
Who Is Really Acquiring Apple’s Customers?
Here is a question most people never ask about Apple: who is actually paying to bring in new customers?
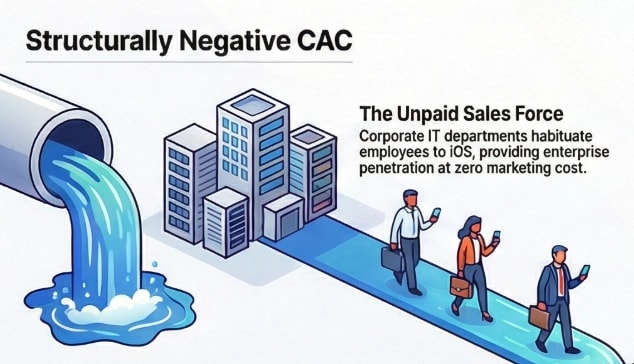
The obvious answer is Apple — through its marketing, its retail stores, its product launches. But the honest answer is mostly somebody else. Apple has built a system where outside parties spend their own money to grow Apple’s business, and Apple collects a toll on the result.
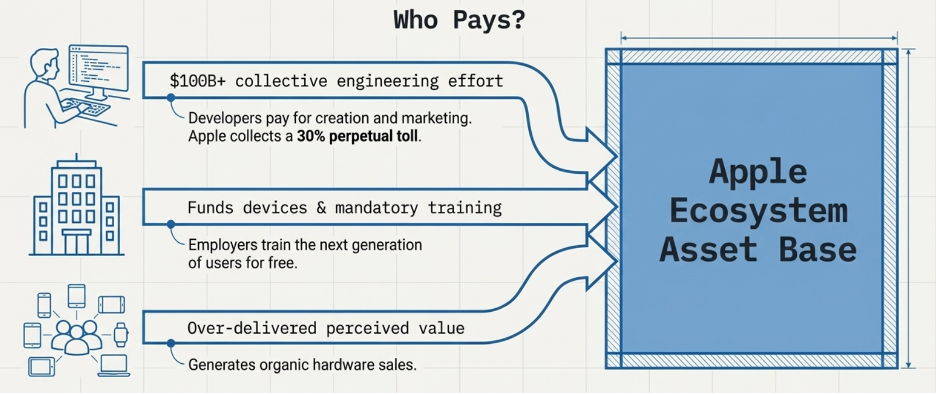
Start with app developers. When a developer builds an app for the iPhone, they are making a real financial bet. They hire engineers, spend months building the product, then run marketing campaigns to tell the world it exists. If the campaign works and someone downloads the app, one of two things happens. Either that person already owns an iPhone — in which case the app has deepened their attachment to the platform — or they do not own an iPhone yet, and the app just gave them a reason to buy one. Either way, Apple wins. The developer paid for everything. Apple collected 30% of all revenue the app generates, forever, and ended up with a platform that is now more valuable than it was before.
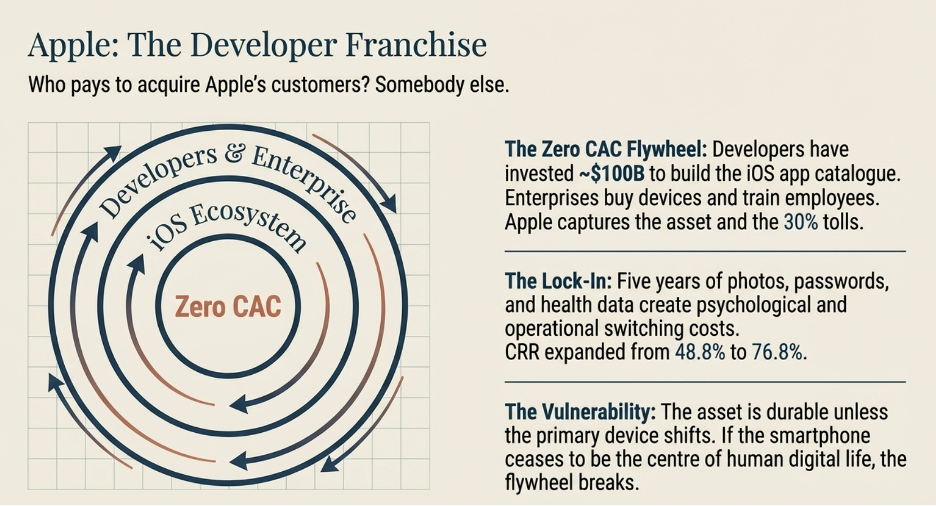
Apple did not pay to build that app. Apple did not pay to market it. The developer community has collectively invested roughly $100 billion in engineering effort building the iOS app catalogue. Apple contributed none of that capital. It received the asset.
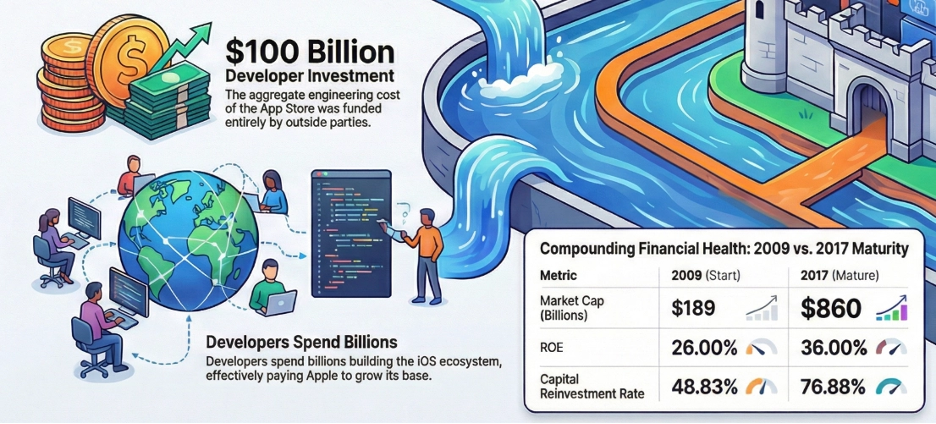
Now think about what this means using the LTGP:CAC framework. CAC is what it costs to acquire a customer. LTGP is the total profit that customer generates over their lifetime. A ratio of 3:1 is a workable business. A ratio of 10:1 is exceptional. Apple’s ratio through the developer channel is not 10:1 — the CAC is effectively zero, because others are doing the acquiring and delivering the customers to Apple. When the cost of acquisition is zero, every dollar a customer generates over their lifetime is pure return on an acquisition cost that was never paid. When we add devices into the equation, they form a large initial fixed cost (e.g. press releases). But as LTGP is realized and grows over the period of time the customer spends in the ecosystem, the CAC becomes negligible. This demonstrates an example of the high-operating leverage business economics of Apple.
Companies contribute a second acquisition channel that rarely gets discussed. When a business buys iPhones for its employees — and millions of businesses around the world do — the company pays for the devices, sets them up, and trains its staff to use them. In doing so, it produces a generation of workers who spend years becoming fluent on iOS in a professional context and naturally carry that preference into their personal lives. Apple never sent a salesperson. The employer did the work for free
.An additional thing to add is “Customer evangelism”. Because the quality of the product was so strong and delivered value far beyond what the customer perceived they were paying for, advocacy and evangelism for the brand was strong. This resulted in sales of devices where Apple need not allocate additional marketing or advertising budget for. Looking from a first principles perspective, it also suggests that marketing principles are extremely important. In order to over deliver on perceived value, a business has to first understand deeply who the customers are, what problems they are specifically solving for, and how does it influence their specific demographic status. How it is solved for (logical or psychological solutions) is extremely important in creating perceived value as well. And hence, it is vital that the investor understands the economics of customer evangelism if a brand has one.
Why Leaving Becomes Almost Impossible
Every app a user accumulates on their iPhone makes them slightly harder to move to a competitor. Five years of photos organised in Apple’s system, messages in iMessage, notes in Apple Notes, saved passwords in iCloud Keychain, fitness data in Apple Health — none of this transfers cleanly to an Android phone. The cost of switching is not just the price of a new handset. It is mental capacity and time required to learn how to operate around the ecosystem and the realisation that five years of digital life has been built inside Apple’s walls, and most of it cannot be taken out.
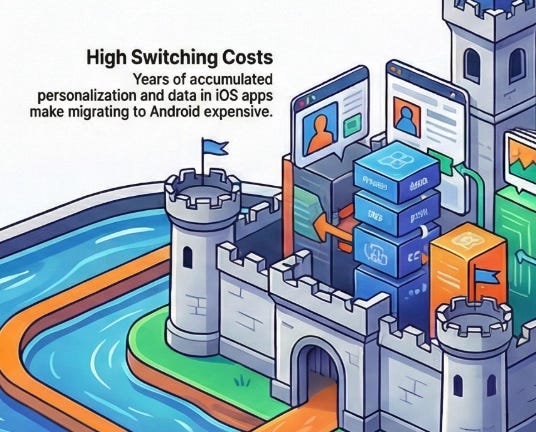
Developers build this lock-in without intending to. Every app they publish adds another layer of personalisation that makes a user’s iPhone feel uniquely theirs. The more the phone feels like yours, the more leaving it feels like leaving part of yourself behind.
Apple then added Services on top. iCloud storage, Apple Music, Apple Pay, AppleCare — each subscription raises the monthly revenue Apple earns from a user who was already acquired years ago through someone else’s marketing spend. A user paying for three Apple services generates $25 to $30 per month in recurring revenue for Apple. That revenue carries almost no acquisition cost, because the acquiring happened long ago and was paid for by somebody else.
How the iOS Platform Turned Local Supply and Demand Into Compounding Scale
Before the App Store became a global phenomenon, it was a single platform serving one device. That specificity was not a limitation — it was the seed of the moat.
Apple’s supply advantage in the early smartphone market was chip and software integration: devices that performed materially better than Android alternatives at the same price tier, because the chip was designed for exactly one device running exactly one operating system. This drew a specific user: the premium buyer — high-spending, willing to pay for digital products, credit card on file.
That specific user concentration is what triggered the demand-side dynamic. Developers face a simple economic question when deciding where to build first: where are the users who actually pay? In the early smartphone era, the answer was unambiguous — iOS. Developers invested their own capital into that ecosystem, which enriched the app catalogue, which deepened switching costs, which attracted more premium buyers.
Now the economies of scale crystallise. Apple’s chip R&D budget — billions per year — is spread across hundreds of millions of identically-configured devices running one operating system. Every additional iPhone sold reduces the effective per-device R&D cost. A competitor designing chips for a fragmented Android ecosystem cannot achieve this: their R&D must cover dozens of device configurations across multiple price points. Their fixed R&D cost per premium device is structurally higher because the premium device is one configuration among many, rather than the sole focus of the engineering investment.
This is the precise mechanism. The supply advantage (better chip economics through focused R&D) drew the premium users into a specific platform. The demand advantage (developer investment, switching costs) trapped them there. The concentration of those users in one ecosystem spread Apple’s fixed costs over a growing base, which improved chip economics, which maintained the supply advantage, which sustained the user concentration. The loop reinforces itself. A competitor must replicate not just the chip or the app store, but both simultaneously in the same specific market segment — and must do so starting from zero volume while Apple’s per-device fixed costs are already lower than anything they can achieve.
The financial result is visible in the compounding. Between 2009 and 2017, Apple’s Cash Reinvestment Rate expanded from 48.83% to 76.88%. Return on equity grew from 26% to 36%. Market capitalisation went from $189 billion to $860 billion. These are not the numbers of a company that launched a popular product. They are the numbers of a platform where the fixed cost of excellence is being spread across a user base that is structurally prevented from leaving.
What Creates the Operating Leverage
Apple’s operating leverage comes from a simple structural fact: the App Store and the Services layer were built once, and the cost of running them does not meaningfully grow each time a new user joins.
Apple spent billions building the App Store infrastructure — the servers, the payment processing systems, the app review process, the developer tools. That cost was incurred once. Today, whether Apple processes 10 million transactions through the App Store or 10 billion, the fixed cost base of that infrastructure is largely the same. Every additional transaction flows through at an extremely high incremental margin because the infrastructure it requires is already paid for.
The same logic applies to iCloud, Apple Music, and Apple Pay. The servers exist. The engineering teams that maintain them are already employed. Adding one more subscriber costs Apple almost nothing relative to the revenue that subscriber generates. As the installed base of iPhone users grows and an increasing share of them subscribe to multiple services, revenue scales continuously while the cost base that supports it grows far more slowly. This is why Apple’s operating income has grown dramatically faster than its revenue over time — the leverage structure of the Services business ensures that as scale increases, each additional dollar of revenue converts to profit at a higher rate than the dollar before it.
What Keeps a Competitor Out
To understand why Apple’s position is structurally defensible, imagine a serious, well-funded competitor deciding to build a competing smartphone platform from scratch today.
The first problem they face is the app catalogue. The iOS App Store has over two million applications built by developers who chose iOS because that is where the paying customers are. To attract those developers to a new platform, the competitor needs to demonstrate a large, high-spending user base. But to attract a large user base, they need a compelling app catalogue. They cannot have the user base without the apps, and they cannot have the apps without the user base. This is the two-sided network trap — both sides of the marketplace need the other to already exist, and neither will arrive first.
The second problem is switching cost. Even if the competitor builds a compelling device and attracts some developers, they are asking consumers to abandon years of accumulated digital life. The consumer bears a real personal cost to switch that the competitor’s product has to overcome before it can be evaluated on its own merits.
The third problem is Apple Silicon. Apple designs its own chips, which means the performance and efficiency of Apple hardware is directly co-optimised with the software running on it in a way that a competitor using third-party chips simply cannot match. Qualcomm or MediaTek produce chips that must perform reasonably well across dozens of different manufacturers’ devices. Apple designs a chip specifically for one device running one operating system. The result is a performance advantage that compounds with every chip generation.
Why the Asset Is Durable
Apple’s chip design capability is highly durable across paradigm shifts for a straightforward reason: the capability is the thing, not the specific application of it. The same team infrastructure and process that designed the A-series chip for phones designed the M-series chip for laptops. Whatever computing form factor comes next — wearables, spatial computing, or something not yet named — the capability to design a chip deeply co-optimised with the software running on it travels with Apple into that new paradigm. In other words, as Li Lu mentions “the only constant in business is change”, and the ability for a company to handle change consistently well is the Ultimate Holy Grail.
The App Store ecosystem is conditionally durable — and the condition is simple: developers go where the users are.
When a developer decides where to build their app, they are making a business decision. They want to reach the largest possible number of paying customers with the least friction. In 2008, the answer was obvious: build for iPhone. That is where the users were. So developers built for iPhone, which made iPhone more valuable, which attracted more users, which attracted more developers. The flywheel spun.
But here is the vulnerability hiding inside that logic. Developers do not follow Apple. They follow users. And users follow the device they use most in their daily life. In the 2000s, that device was the phone. The phone became the center of people’s digital lives — the thing they reached for first thing in the morning and last thing at night. Whoever owned the dominant phone owned the relationship with the user.
Now ask a different question: what if the phone stops being that device?
Not because phones disappear — they won’t — but because something new becomes the primary way people interact with technology. Maybe it is a pair of glasses that overlays information onto the physical world. Maybe it is a watch that handles most of what a phone once did. Maybe it is something nobody has invented yet. Whatever it is, if people start spending more time on that device than on their phone, developers will start building for that device first. And whoever owns the dominant version of that device will own the user relationship Apple currently owns through the iPhone.
This is Apple’s Achilles heel. The flywheel — developers funding the ecosystem, users getting locked in through accumulated data and apps — only works as long as the iPhone is the device people’s digital lives are built around. The moment a new device displaces the phone as the center of daily life, Apple’s flywheel breaks unless Apple is the one who built that new device first.
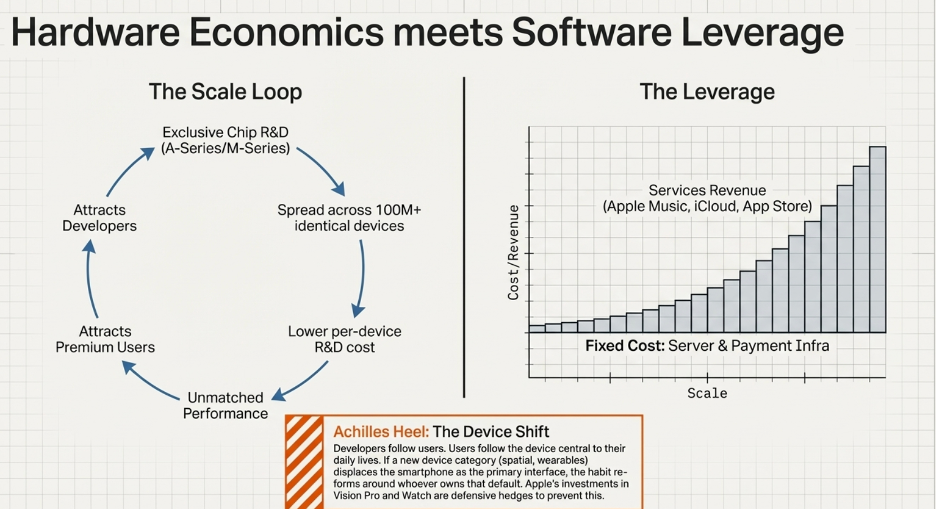
This is why Apple invests in Vision Pro, Apple Watch, and AirPods — not because these products are currently as important as the iPhone, but because Apple is deliberately planting flags. They are seeding early user bases in each new device category so that if one of them becomes the next center of digital life, Apple is already there with users, which means developers will follow, and the flywheel spins up again. If a competitor builds that device first and reaches the scale where developers flock to it, Apple would find itself on the outside of its own trap — needing the users to attract the developers, and needing the developers to attract the users, with neither in hand.
Alphabet — One Engine, Three Fuel Lines
Start Here: The Engine Everything Feeds
To understand how Google makes money, you need to understand one central mechanism first: the advertising auction.
When you search “best running shoes,” Google does not simply show you a list of shoe websites. It runs an instant auction among every shoe advertiser who wants to reach someone searching that exact phrase. Each advertiser bids for placement. The winner pays per click. Google collects that payment.
This auction is the engine of everything. It is where Google’s revenue is actually generated. And crucially, the auction gets more valuable the more accurately Google can predict which ad a specific user is most likely to click and act on. An advertiser does not just want clicks — they want purchases. A click that converts to a sale is worth far more to them than a click that bounces. So advertisers pay more per click when they trust that Google’s system is genuinely matching their ad to someone likely to buy.
What makes the matching more accurate? Behavioral data. The more Google knows about what a specific user wants — what they have searched before, what they clicked, what they purchased — the more precisely it can match that user to the right advertiser. Better matching means advertisers pay higher prices per click, which means more revenue per search, which means the LTGP of every user grows automatically over time without Google needing to acquire new users to grow revenue.
This is the core engine. Now understand the three fuel lines feeding it.
The Three Mechanisms — and How They Are All the Same Thing
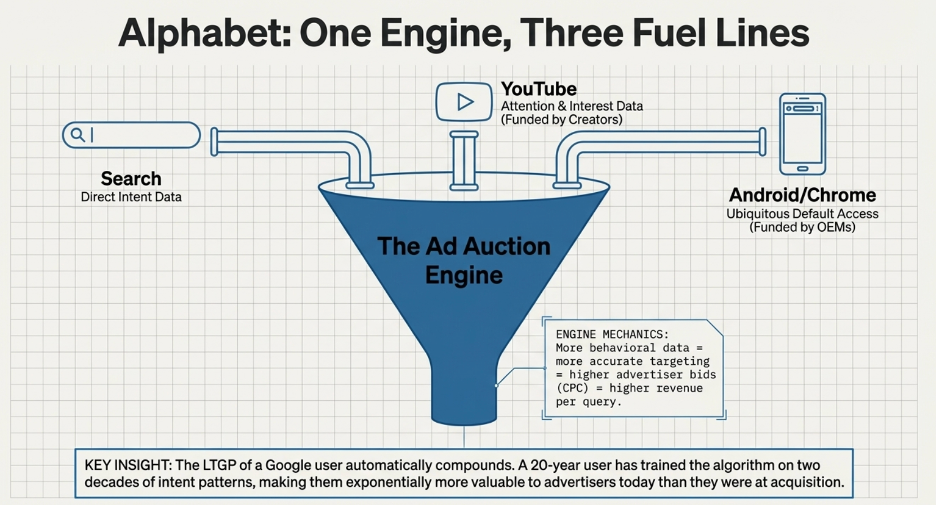
The first fuel line is Google Search itself. Every time a user searches for something, two things happen simultaneously. Google shows ads and earns revenue. And Google learns something new about that user — what they were looking for, what they clicked, how their intent evolved when they refined the query. The user is both the customer and the raw material. Each search makes the auction smarter, which makes the next search more valuable to advertisers, which means Google earns more from the next search than it did from the last one. The engine improves itself as it runs.
The second fuel line is YouTube. Every creator who publishes a video on YouTube has invested their own money — in equipment, editing time, audience building — to produce content that now lives on Google’s platform. Google did not pay for that content. The creator paid for it. When a user watches that video, Google shows ads against it and keeps 45% of the ad revenue (paying the creator 55%). But more importantly, that viewing session teaches Google something about that user’s interests — what content they engage with, for how long, what they watch next. This behavioral signal flows directly into the advertising auction. A user who watches hours of cooking content is now more precisely targetable for a kitchen appliance advertiser. YouTube’s content library, built entirely at creators’ expense, is essentially a behavioral data collection system that continuously enriches the auction engine.
The third fuel line is Android and Chrome. Google pays phone manufacturers — Samsung, Xiaomi, and others — to install Google Search as the default experience on every device they ship. The manufacturer funds the product, the marketing, and the distribution. The user turns on the phone, encounters Google, and begins generating search data immediately. Google’s cost of acquiring that user’s behavior is a fraction of what direct marketing would cost. Across billions of Android devices globally, this is how most of the world’s search queries — and therefore most of the auction’s training data — arrive on Google’s servers.
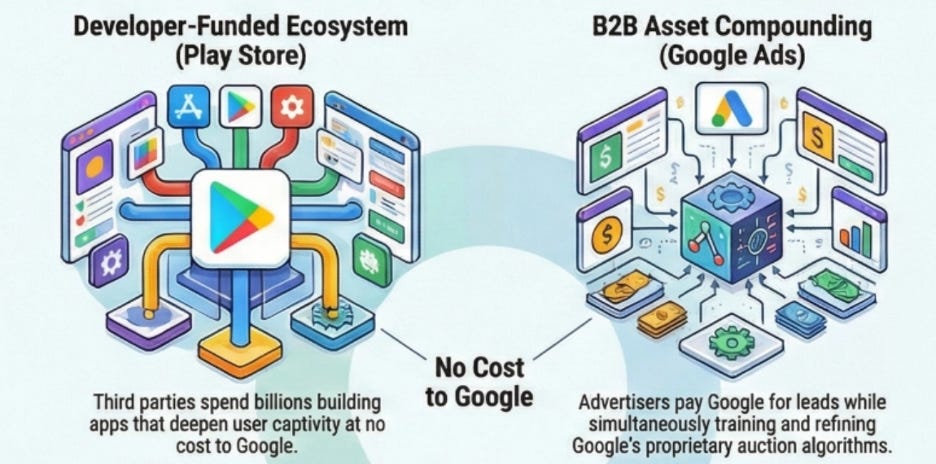
Here is the link that makes all three mechanisms one thing: they are all pipelines delivering behavioral data into the same auction. Search queries, YouTube viewing patterns, and Android usage all feed the same central engine. The more data that flows through each pipeline, the more accurate the auction becomes, the higher advertisers bid per click, and the more revenue Google earns per user. Each mechanism makes the other two more valuable. A user who searches on Google, watches YouTube, and uses an Android phone contributes behavioral data from three different angles simultaneously. That combined profile is worth far more to an advertiser than any single signal alone.
The Supply and Demand Advantage — and How They Lock Together
Google’s supply advantage is the search index itself: 25 years of crawling the entire internet, storing and ranking hundreds of billions of pages, and learning from trillions of queries which results users actually find useful. This index was not built in a month or a year. It was built through sustained investment across a quarter century, and — critically — it was continuously improved by user behavior. Every time a user clicked a result and stayed, the algorithm learned that result was good. Every time they clicked and immediately returned to the search page, it learned the result was bad. The index got smarter because users used it. No competitor can buy 25 years of behavioral refinement. The only way to have it is to have been operating 25 years ago.
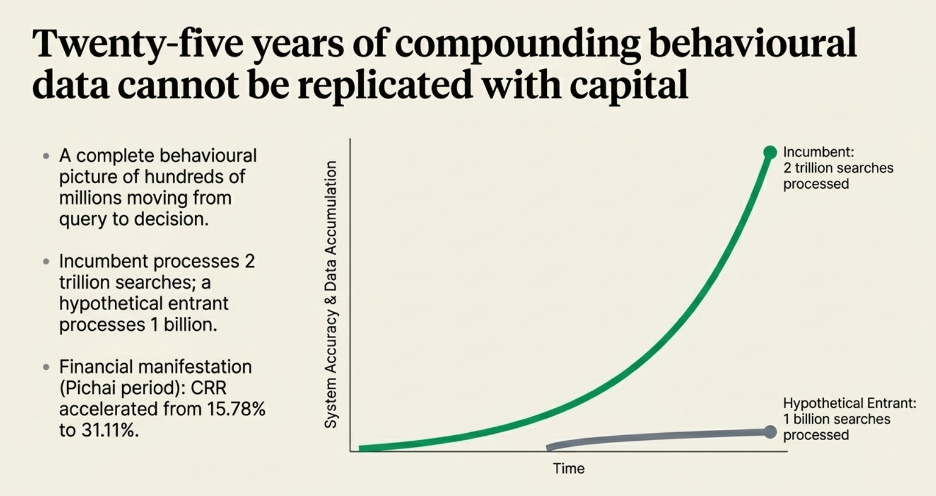
Google’s demand advantage is the search habit. When someone needs information, they do not decide which search engine to use. They open a browser and type. The behavior is automatic. It is encoded below the level of conscious decision-making — the same cue-routine-reward loop described in the Coca-Cola section, operating here at the level of information-seeking rather than beverages. The cue is “I need to find something.” The routine is opening Google. The reward is finding it. Across billions of people who have executed this loop thousands of times over two decades, it is one of the most deeply embedded digital habits in human behavior.
Now here is where supply and demand lock together to create economies of scale. Google’s index infrastructure — the server farms, the crawling systems, the ranking algorithms — is a largely fixed cost. It exists whether Google processes one billion searches per day or ten billion. The cost of serving one additional search is, for practical purposes, close to zero. But each additional search generates advertising revenue and simultaneously improves the auction through new behavioral data. As query volume grows — driven by the habit on the demand side — revenue scales against a cost base that barely moves. This is operating leverage in its most direct form: fixed cost, scaling revenue, with each additional unit of revenue carrying almost no additional cost to produce.
The economies of scale compound further through the auction mechanism itself. More queries means more advertiser competition for placements, which drives up the price per click. Higher prices per click mean Google earns more per unit of volume. As the user base grows and the habit deepens, Google earns more from the same behavioral infrastructure — not by spending more, but because scale in a fixed-cost auction system naturally produces higher revenue per query over time.
Why the Habit Is the Most Important Barrier to Entry
The conventional analysis of Google’s moat focuses on the data advantage and the two-sided network between users and advertisers. Both are real. But neither is as important as the habit itself, for one straightforward reason: if the habit were to break — if people stopped automatically reaching for Google when they needed information — the data advantage would stop growing and the advertiser network would follow users wherever they went.
The habit has not broken. Google’s global search market share has remained above 90% for over a decade, across the introduction of smartphones, social media, voice assistants, and most recently, conversational AI. This persistence is not accidental. It reflects something structural: the habit of searching is the habit of asking a question and expecting an answer. The format of the answer — whether it is ten blue links, a featured snippet, or an AI-generated summary — is an implementation detail. The behavior of reaching for Google when you need to know something is the thing that matters, and that behavior has not changed.
The AI point is worth being precise about. When ChatGPT launched in late 2022, a common prediction was that conversational AI would displace search. What actually happened is more instructive. Google’s response was to integrate AI-generated summaries directly into the search results page — so users who open Google now receive an AI-assisted answer without leaving the Google experience. The habit-forming trigger — opening a browser, typing a query — remained entirely intact. Google simply changed what appeared in response to that trigger. From the user’s perspective, nothing about the initiation of the behavior changed. And because Google owns the default experience on Chrome and Android — the browsers and devices through which the majority of searches globally are initiated — even users who want AI-assisted answers encounter Google’s AI first.
A competitor with a better AI product still faces the same distribution problem: they need to change a deeply embedded habit before they can reach the users whose behavior they want to capture. Google’s distribution infrastructure — pre-installed defaults on billions of devices — means that any new AI product Google launches reaches the world’s population of habitual searchers immediately, through the same channel they already use. A new entrant needs to first break the habit and then build a new one. That sequence has never been achieved at scale against Google in over two decades of competition.
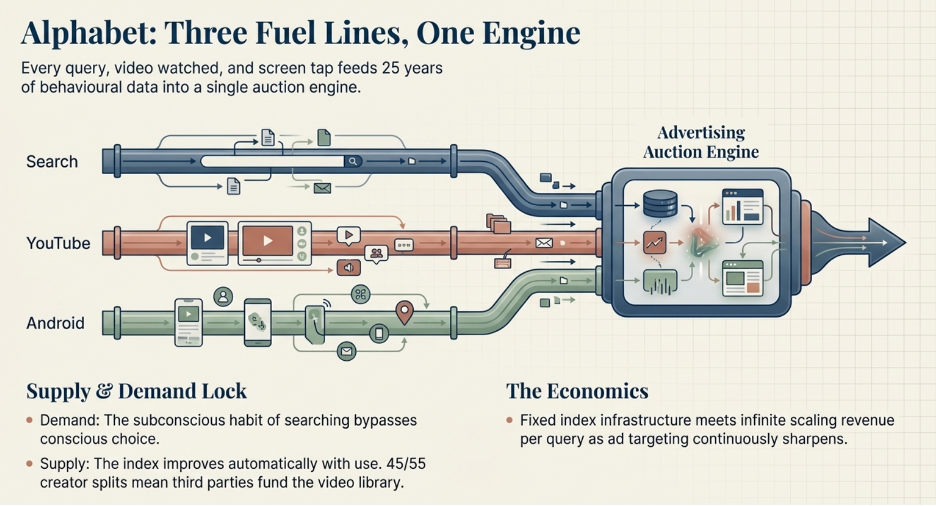
The LTGP of a Google User
The LTGP mechanics in Google’s model are particularly elegant because the value of each user grows automatically over time without any new acquisition effort.
A user who started searching on Google in 2004 has contributed 20 years of behavioral data to Google’s auction. Google’s algorithm knows more about that user’s intent patterns — their professional interests, their consumer preferences, their seasonal behaviors — than any competitor who acquired them last year. The precision of ad targeting for that user is correspondingly higher, which means advertisers pay more to reach them, which means Google earns more revenue per search session from that long-tenured user than from a new one.
Meanwhile, YouTube’s creator ecosystem continuously increases the time users spend on Google’s platform — each additional hour of viewing generates more behavioral signal and more advertising inventory. The user does not need to do anything new. They simply continue the habits they formed years ago, and the revenue Google earns from each habit-driven session grows as the targeting becomes more precise.
The CAC for most of these users was paid once, years ago, through the Android pre-install or the organic habit of typing “google.com” into a browser. That acquisition cost has long been amortised. Every session since then is revenue against a cost that was already paid. This is the most favorable version of the LTGP:CAC ratio: a customer acquired at low cost whose lifetime value keeps compounding upward as the underlying data asset improves.
What Keeps a Competitor Out
To build a competing search business, you need three things simultaneously: a user base large enough to generate behavioral data at scale, an advertiser network large enough to create meaningful auction competition, and a search index accurate enough that users trust it over the incumbent. You cannot build the user base without the index quality, you cannot build the index quality without the behavioral data, and you cannot build the advertiser network without the user base. Every side of the market requires the other sides to already exist.
Google has been the only player inside this loop for 25 years. The behavioral data it has accumulated through that period is the most complete record of human information-seeking intent ever assembled. A competitor entering today with equivalent technology would begin with an index trained on zero behavioral signal from real users. Their results would be less accurate than Google’s from day one. Less accurate results means fewer users trust them, which means less behavioral data accumulates, which means the gap widens rather than narrows over time. The competitive disadvantage compounds in the incumbent’s favor — the opposite of what happens in most markets, where the incumbent becomes complacent and the new entrant improves.
The habit and the data are the two sides of the same lock. The habit ensures that users keep generating data for Google and not for competitors. The data ensures that Google’s results keep improving, which reinforces the habit. A competitor needs to break both simultaneously to gain a foothold. In 25 years, no one has managed it.
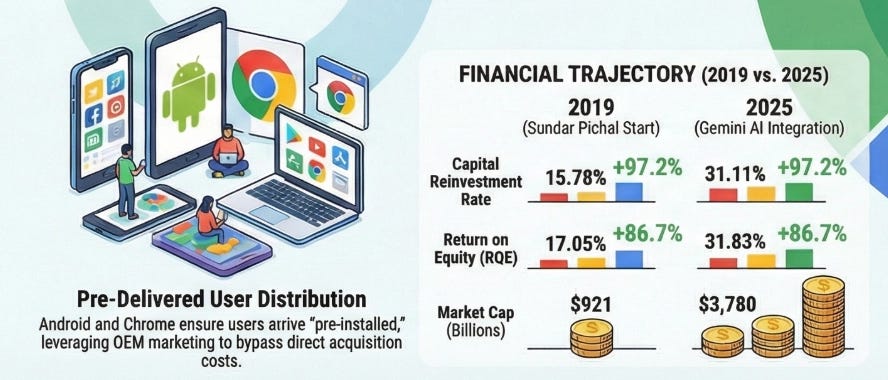
Why the Asset Is Durable
There is a useful test for whether any asset is truly durable: ask what would have to change in human behavior for the asset to become irrelevant. For Google, that question has a very specific answer — and it is far harder to achieve than most critics of Google’s moat appreciate.
The search habit would have to break. Not just weaken. Break.
Consider what that actually requires. A person would need to encounter a new way of finding information that is so consistently and dramatically better than typing a query into Google that they consciously override an automatic behavior — one they have rehearsed thousands of times over two decades — and replace it with something new. And they would need to do this not once, but every single time the information-seeking cue fires, for long enough that the new behavior becomes the automatic one instead. This is how habits are replaced. It is slow, effortful, and it requires the new alternative to be compelling enough to sustain the effort across hundreds of repetitions until the old pattern fades.
Google’s data asset has a specific durability property that makes this even harder. It improves with use. Every search that flows through Google’s system makes the next search slightly better — more relevant results, more accurate ad matching, more precisely understood intent. This means the asset is not static. It is not a moat that was dug once and sits unchanging while competitors approach it. It is a moat that gets deeper every day that users continue their habit. A competitor who launched a genuinely superior search product today would spend years building toward the accuracy Google already has — and during those years, Google’s asset would continue compounding from a base that is already 25 years deep.
YouTube adds a second layer of durability that operates independently of search. The asset that matters on YouTube is not the content itself — individual videos come and go, trends shift, formats change — but the recommendation engine’s understanding of human attention. YouTube’s algorithm has observed billions of viewing sessions, learned which content holds attention for how long across which demographics, and built a behavioral model of entertainment consumption that is among the most sophisticated ever assembled. This model does not care what the content is. When short-form video displaced long-form content, the algorithm did not need to be rebuilt — it simply learned the new pattern from the users migrating toward it. When a new format emerges, the same thing will happen. The asset reshapes itself in the direction users are already moving, which means it remains accurate regardless of how content preferences evolve.
Android extends both of these properties to every new population that comes online. Every person who buys their first smartphone in a developing market — and there are still hundreds of millions who will — turns on an Android device, encounters Google as the default experience, and immediately begins contributing to the behavioral data pool. The asset expands with global internet adoption automatically, without Google needing to do anything new. The supply of new users training Google’s systems is not exhausted. It grows with global connectivity.
The one genuine durability risk is not a competitor. It is a shift in the device through which information-seeking occurs — the same Achilles heel described in the Apple section. If a new device category became the primary way people find information, and Google was not the default experience on that device, the habit could theoretically re-form around whoever owned that default. This is why Google’s distribution investments — Android, Chrome, the agreements with device manufacturers — are not just about today’s market share. They are about ensuring that whatever device becomes central to human information-seeking in the next decade, Google is already inside it before the habit forms around someone else.
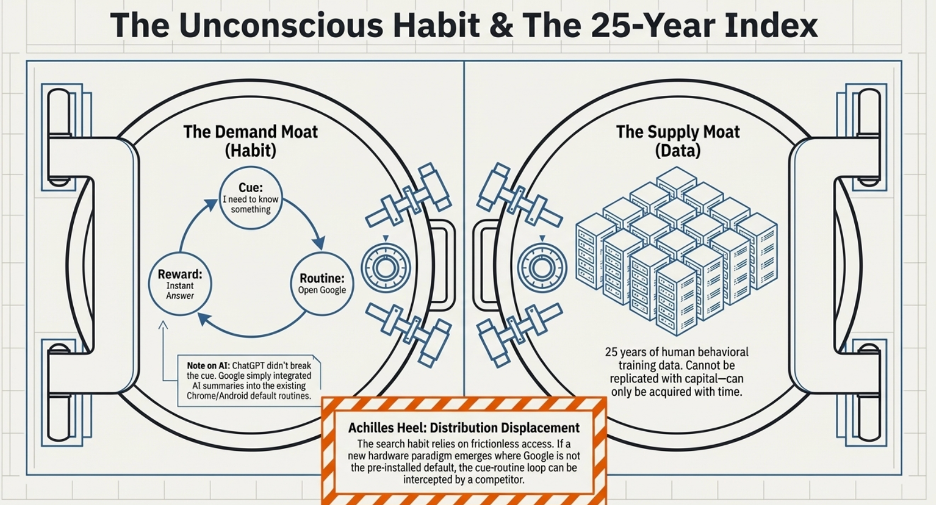
Amazon — The Franchise Hidden in Plain Sight
Who Is Really Building Amazon’s Business?
The most accurate description of how Amazon actually works is this: Amazon is a franchisor. The franchisees fund customer acquisition, bear the operating costs, and pay Amazon a fee on every transaction. Amazon keeps the brand, the behavioral data, and the long-term customer relationships.
Every third-party seller on Amazon pays listing fees, pays fulfillment fees through FBA, and pays for advertising on Amazon’s own platform. In the period studied, Amazon’s revenue from third-party services and advertising combined exceeded half of total company revenue. But the economic significance goes beyond the fees themselves.
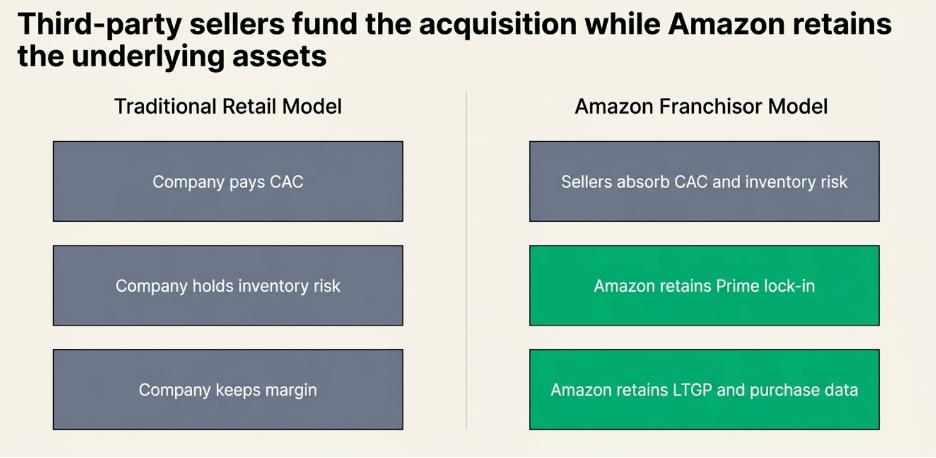
Every seller who runs external marketing campaigns — ads on Google, posts on Instagram, campaigns on TikTok — and directs those campaigns toward their Amazon product listing is spending their own money to bring customers to Amazon’s platform. When those customers arrive and buy something, they become Amazon customers. They discover Prime. They may subscribe. From that point forward, their purchasing data and their future spending belong to Amazon.
The seller paid to acquire that customer. Amazon owns the relationship that results. A traditional franchise at least gives franchisees geographic exclusivity and some ownership of the customer relationship. Amazon gives neither. Sellers compete with each other in the same product categories on the same pages, and they compete with Amazon’s own private-label products built using the data Amazon collected from watching their sales. The sellers fund the acquisition machine. Amazon owns the assets that are built from the machine.
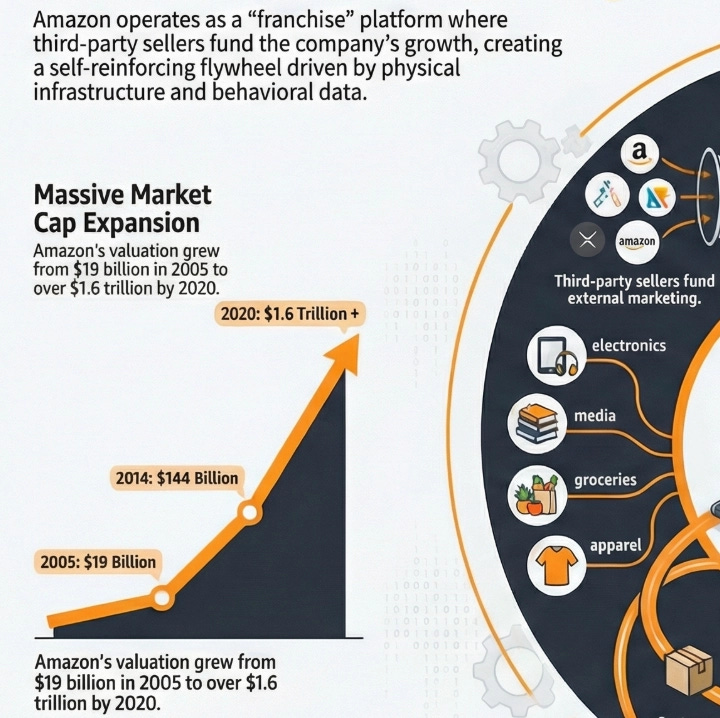
The Prime Mechanism
Amazon Prime works through a psychological principle that every gym owner understands: the sunk cost. A Prime member who has already paid $139 for the year is motivated — often unconsciously — to route as much purchasing through Amazon as possible to feel like they got their money’s worth. This is not a loyalty programme. It is a pre-commitment mechanism. The customer has already decided, financially, that Amazon is where they shop, and if they chose not to shop on Amazon, they experience the psychological pain of “losing” that pre-paid membership — one of our most powerful cognitive biases.
This pre-commitment means that every new category Amazon enters — grocery, pharmacy, automotive parts, luxury goods — arrives with a built-in customer base who are already inside the ecosystem, already have their payment details stored, and are already motivated to consolidate their purchasing on Amazon. When Amazon entered pharmacy, it did not need to convince Prime members to try a new option. The Prime membership had already done the selling. The incremental customer acquisition cost was close to zero, while the LTGP of the existing customer just increased.
Every time a Prime member makes a purchase, Amazon learns something. What they bought, what they looked at but did not buy, how price-sensitive they are, what they return, how their habits change across seasons and life stages. This behavioral record is what makes Amazon’s advertising business valuable in a way that most digital advertising is not — it is based on what people actually bought, not what they are assumed to be interested in based on their demographics.
The compounding loop works like this: more sellers list products → more selection makes Prime more attractive → more Prime members generate more purchase data → the data makes advertising targeting more precise → advertisers pay more per click → that revenue funds lower prices and faster delivery → more people join Prime → more sellers want access to those members. Every participant is either paying Amazon directly or generating data that Amazon monetises.
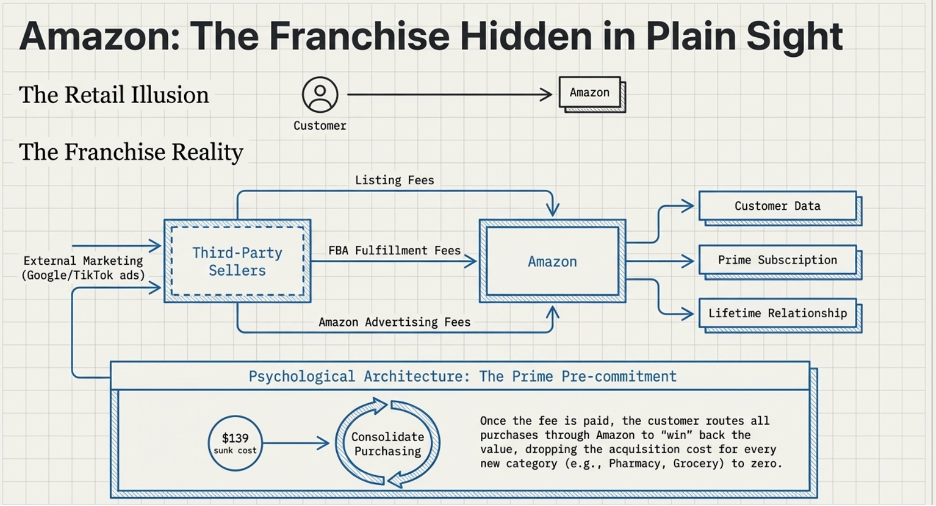
How One Fulfillment Center in One City Became an Unassailable Network
Amazon’s logistics moat is usually described at the national or global level. But the economics that make it a genuine barrier to entry are built locally — one fulfillment zone at a time — and it is this local structure that explains how the supply and demand advantages lock together to produce scale that is structurally hard to replicate.
Start with a specific fulfillment center — say, the one Amazon built in the Baltimore area in the mid-2000s. That facility is a fixed cost: the land, the building, the conveyor systems, the staffing, the management infrastructure. The per-unit delivery economics of that facility depend entirely on how many orders flow through it per day. At low volume, the cost per delivery is high. At high volume, the same fixed facility cost is spread across far more deliveries, and the per-delivery cost falls dramatically.
Prime created the volume guarantee that made those economics work. A Prime member in that region who has paid their annual fee is behaviorally committed to routing purchases through Amazon. This generates predictable, recurring, concentrated order volume flowing through that specific fulfillment center. And that predictable volume is exactly what converts the fixed cost of the facility into a per-unit profit advantage.
Here is the flywheel at the local level. Prime creates demand-side volume concentration in a specific region. That volume makes the supply-side fulfillment center economically viable at a per-delivery cost competitors cannot match without comparable volume. Better delivery economics allow Amazon to offer faster and cheaper shipping, which makes Prime more valuable to more consumers in that region, which grows membership, which grows volume, which reduces per-delivery cost further. The supply advantage — lower per-delivery cost from infrastructure density in that region — and the demand advantage — Prime behavioral commitment — are locked together. Each reinforces the other within that specific geographic area.
A competitor trying to enter e-commerce delivery in that same region faces the same fixed facility cost Amazon paid. But they have no Prime membership base to guarantee volume on day one. Their cost per delivery is structurally higher than Amazon’s — not because they are less capable, but because they have fewer units to spread the same fixed cost across. They cannot reduce that cost without volume, and they cannot build volume without competitive delivery economics. They are locked out by the arithmetic of fixed costs and concentration, not by technology or talent.
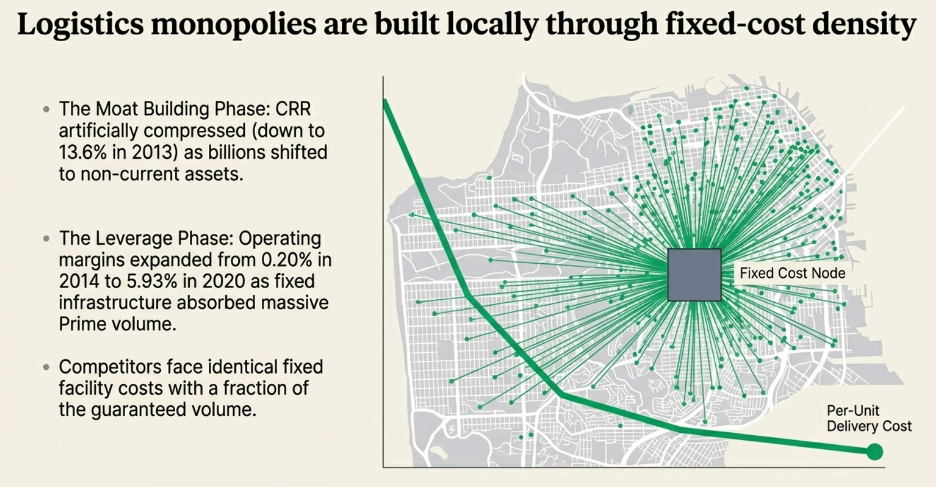
The financial data tells this story precisely. Amazon’s CRR was 35.13% in 2005 — high, consistent with a relatively asset-light retail operation. By 2013 and 2014, CRR had compressed to 13.6% and 18.64% respectively. This compression is not deterioration. It is the moat being constructed. Amazon was deploying billions into fulfillment center construction across dozens of geographic markets simultaneously, growing its non-current asset base far faster than its adjusted operating income. As mentioned above early in this writing: for a company building a durable moat through growth capex, the CRR formula will appear depressed during the initial construction phase (because of depreciation and amortization). However, the economic value those assets will eventually generate, will far exceed the depreciation and amortization. In this case (where a business has a clear moat), depreciation and amortization should be added back to the numerator of the CRR formula.
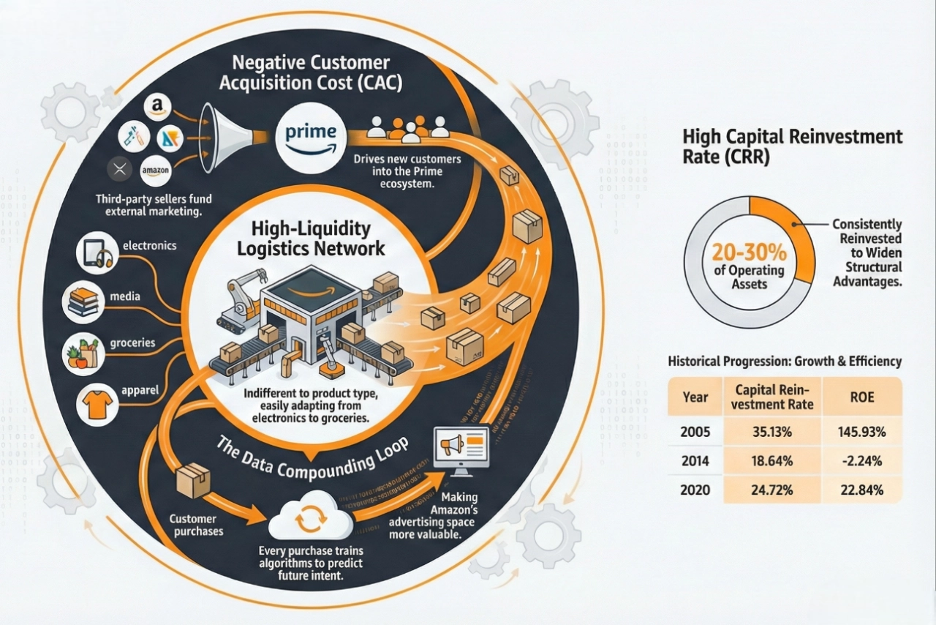
As the fulfillment network reached density in established markets — where Prime volume was high enough to optimise per-delivery costs — the operating leverage showed up in the income statement exactly as expected. Operating margin was 0.20% in 2014. By 2016 it had recovered to 3.08%. By 2019 it reached 5.18%, and by 2020 it was 5.93%. Revenue was scaling against a fixed infrastructure base that had already been built and paid for, and each additional unit of revenue was converting to operating income at a progressively higher rate. CRR recovered to 29.49% by 2019 as this leverage crystallised.
The shift in revenue mix confirms the same story from a different angle. In 2005, Amazon’s revenues were essentially 100% product sales — a retailer earning thin margins on goods it sold directly. By 2014, service revenues (FBA fees, Prime subscriptions, advertising, third-party marketplace commissions) represented approximately 21% of total net sales. By 2019 that figure had grown to 42.82%. This shift matters because service revenues flow through infrastructure that is already built and paid for. Each additional dollar of FBA revenue or Prime subscription contributes to operating income at a much higher marginal rate than product sales, because there is no incremental cost of goods sold to subtract against it.
The balance sheet traces the same arc as every other moat-building business in this study. In 2005, Amazon’s balance sheet was dominated by current assets — inventory, receivables — the profile of a retailer. As the fulfillment network was built out, non-current assets (PP&E, infrastructure, right-of-use assets) grew dramatically as a proportion of total assets. By 2019 and 2020, the current asset ratio had fallen sharply from its 2005 levels, reflecting billions of dollars of fulfillment infrastructure now sitting on the non-current side of the balance sheet. This is the same pattern observed in Apple, Alphabet, and Coca-Cola: current assets declining as a proportion of total as the moat-building capex crystallizes into non-current assets. The moat lives in those long-term assets.
What Creates the Operating Leverage
Amazon’s operating leverage works across two levels simultaneously. At the fulfillment layer, the fixed costs of each regional warehouse network are spread across growing Prime-member-driven order volume. As volume grows, per-delivery cost falls. The facility does not become more expensive when ten million orders flow through it versus one million — the additional revenue at higher volume has almost no additional fixed cost to absorb.
At the marketplace layer, Amazon’s platform infrastructure — the search and discovery systems, the payment processing, the review architecture, the seller management tools — was built once. Whether ten thousand or one million third-party sellers use these systems, the infrastructure cost is broadly the same. Each additional seller generates listing fees, FBA commissions, and advertising revenue against a cost base that barely moves. This is why service revenues growing as a proportion of total revenue translates directly into expanding operating margins: platform economics carry near-zero marginal cost per additional seller or transaction.
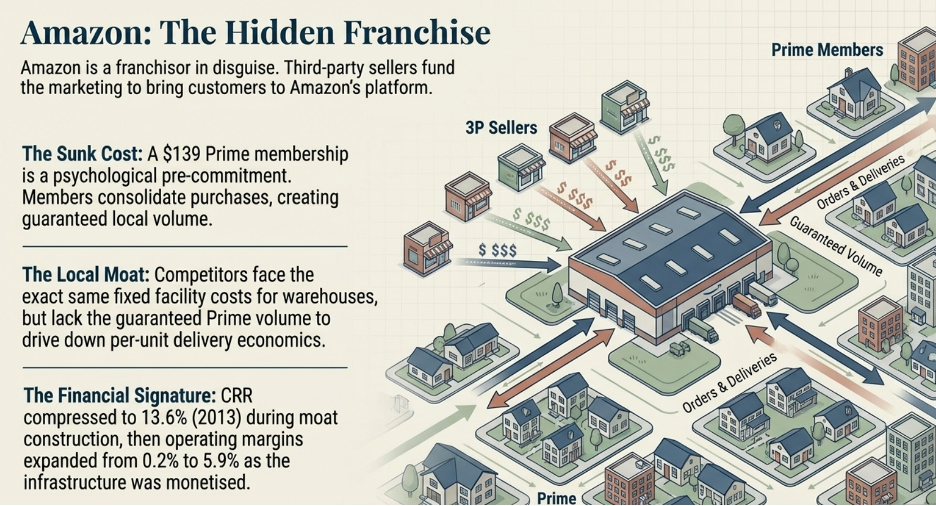
What Keeps a Competitor Out
Amazon’s logistics network creates a barrier that is easy to underestimate: it is not expensive to replicate in principle, but it takes so long to build that time itself becomes the barrier.
A competitor who committed $100 billion today to building a competing logistics network would still spend five to ten years constructing the physical infrastructure, developing the operational knowledge, building the supplier relationships, and establishing the delivery density required to match Amazon’s per-delivery cost in established markets. During those five to ten years, Amazon continues to grow, refining its operations, reducing its costs further, and expanding its Prime membership base. The competitor arrives at the starting line against an incumbent whose advantage has spent a decade further compounding.
The behavioral data asset creates a second barrier that is even less replicable. Amazon’s knowledge of what hundreds of millions of Prime members buy, browse, and consider cannot be acquired through spending or technology investment. It only exists because Amazon has been the platform through which those purchases flowed for decades. A competitor can build a marketplace, but they begin with no knowledge of their customers’ purchasing history and no ability to make the personalised recommendations and advertising matches that Amazon generates from millions of purchase cycles. The gap narrows slowly, if at all, because Amazon’s data advantage continues growing with every Prime transaction even as the competitor’s starts from zero.
Why the Asset Is Durable
Amazon’s logistics infrastructure is the most category-agnostic productive asset in this study. It moves objects from warehouses to addresses. It does not care what those objects are. Whether consumer behavior shifted from electronics to groceries to pharmaceuticals, Amazon’s network did not need to be rebuilt — it needed to extend into new product handling requirements, which are engineering problems rather than infrastructure reconstruction problems.
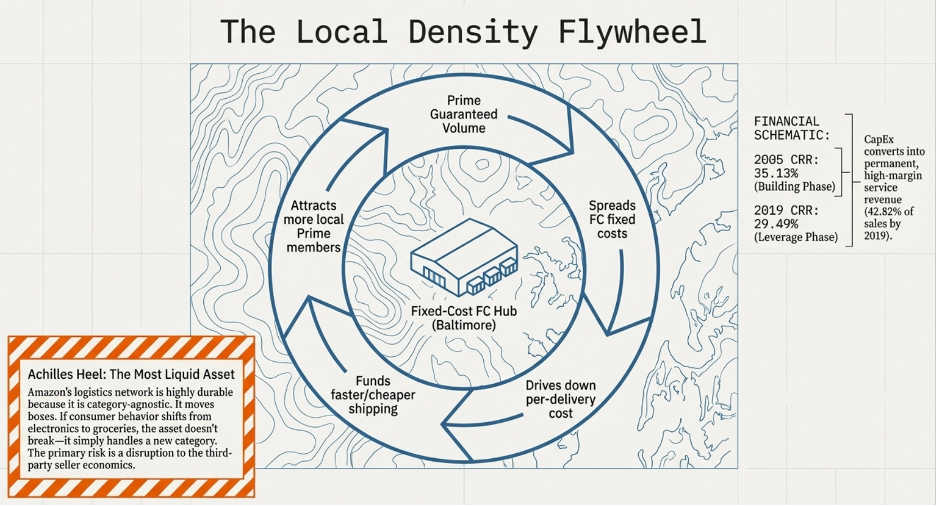
The behavioral data asset is equally liquid — it adapts automatically as customers change what they buy, because the data is generated by customer behavior and therefore mirrors wherever that behavior goes. As new product categories become popular, the recommendation engine learns the new purchasing patterns from the customers already exploring them. The asset does not need to be reconfigured. The customers lead it there.
Coca-Cola — The Moat That Lives Inside the Brain
Why This Is Not a Beverage Business
Coca-Cola is described almost universally as a consumer beverages company with strong brand recognition and excellent distribution. Both are true and neither explains why the business is structurally close to impossible to compete with.
The actual moat is not the distribution. It is not the brand in the conventional marketing sense. It is something more precise and more durable than either: Coca-Cola has encoded an automated purchasing behavior into hundreds of millions of human brains across six generations, and that behavior runs below the level of conscious decision-making every time a specific set of environmental cues appears.
How the Brain Builds an Automatic Behaviour
A habit is not a preference. A preference is something you think about. A habit is something your brain has removed from conscious deliberation entirely and placed on autopilot.
Neuroscientists describe habit formation as a three-part loop: a cue, a routine, and a reward. A cue in the environment triggers a behavior — the routine. The routine produces a reward. When the reward is distinctive enough, and the loop repeats often enough, the brain stops waiting for conscious approval and begins running the routine automatically the moment the cue appears.
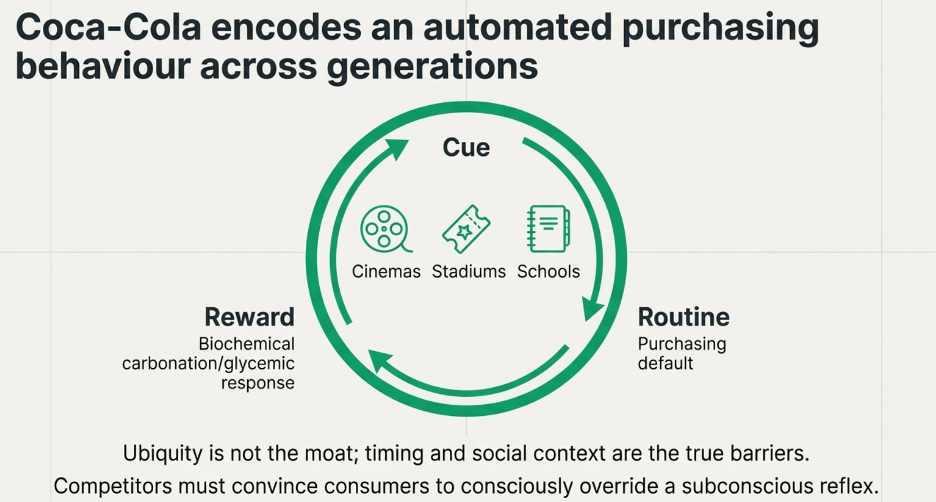
For a habit to form around a specific product, the reward has to be neurologically distinct. This is why water, despite being universally available and genuinely satisfying, never produced a brand habit. Your brain cannot distinguish the experience of drinking one brand of water from another.
Coca-Cola produces a biochemically distinct reward. The carbonation creates a sharp physical sensation that is immediately recognisable. The sugar delivers a glycemic response the brain registers clearly. The caffeine produces a mild stimulant effect. The cold temperature amplifies all of this simultaneously. When a child encounters this combination for the first time — at a birthday party, at a school canteen, at a sports event — the brain receives a cluster of physical experiences it has never had in that specific combination and encodes the product as the source of that experience. That encoding is the beginning of a habit.
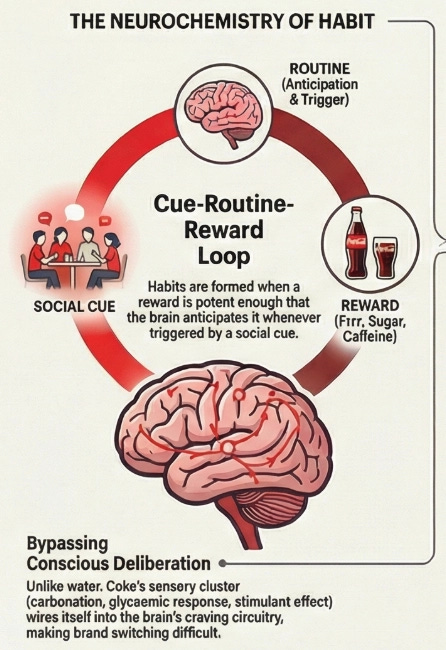
Why Ubiquity Is Not the Moat. Timing Is.
The critical insight that most analyses of Coca-Cola miss is this: the bottling network matters not because it achieves distribution coverage — Pepsi achieves comparable coverage — but because of when and where it places the product.
A young person encountering Coca-Cola at the school canteen, at the cinema, at the sports stadium, and at the fast food restaurant in the same month is being exposed to the same reward signal across multiple different social contexts. Each context becomes a cue. Over months and years of repetition, each of those contexts begins automatically triggering a craving for the product that delivered the reward. The cinema smell becomes a trigger. The crowd noise at a stadium becomes a trigger. The sight of a fast food counter becomes a trigger. With McDonald’s, that option becomes the cheapest default.
By the time that person is an adult, the habit is structural. The contexts fire the craving automatically. The craving produces the purchase without deliberation. They are not choosing Coca-Cola in those moments. The choice happened years ago, encoded through repetition, and now runs without their conscious involvement.
Pepsi illustrates this precisely. In blind taste tests, many consumers cannot reliably distinguish Pepsi from Coca-Cola. In branded contexts, it does not matter. The Coca-Cola habit runs below the level at which a superior product feature can intervene. To dislodge it, a competitor needs to offer something compelling enough to override an automated response — every time the cue appears — for long enough that the old habit fades and a new one forms.
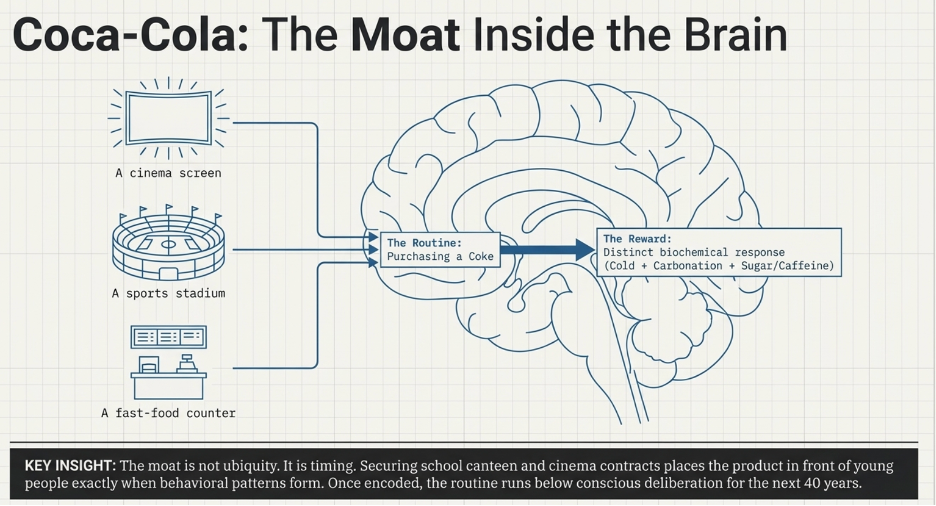
The Franchise Economics: Who Pays for All of This
The Coca-Cola Company manufactures concentrate. That is essentially its entire manufacturing operation. It sells that concentrate to independent bottling partners, who convert it into the finished beverage, bottle it, distribute it to every point of sale, and manage the local commercial relationships — the school canteen contracts, the cinema pouring rights, the stadium exclusivity deals, the fast food partnerships.
Those contracts are not distribution agreements. They are habit-formation agreements. Every school canteen contract that an independent bottler negotiates and funds is placing Coca-Cola in front of young people at the precise life stage when behavioral patterns are being formed most efficiently.
A consumer whose habit was formed at age fourteen through a school canteen contract funded by the bottler represents roughly 30 to 40 years of concentrate purchasing revenue for Coca-Cola Company, with no direct marketing spend required on that individual. The bottler paid to acquire that customer. Coca-Cola captures the lifetime value of the concentrate sales.
How a Bottler Territory Becomes a Fortress
Coca-Cola’s global dominance is the sum of hundreds of local victories. Each local victory follows the same economic logic, and understanding that logic at the local level is what explains why the global position is so structurally difficult to challenge.
Consider any specific bottler territory covering a major metropolitan area. The bottler has invested significant capital in a production facility, a fleet of delivery vehicles, cold storage infrastructure, refrigerator placements in retail locations, and a sales force managing venue relationships. These are largely fixed costs: they exist whether the plant produces ten million cases this year or fifteen million.
The supply advantage operating within that specific territory is the concentrate formula itself. The bottler has one critical input that nobody else can produce: Coca-Cola concentrate, sold exclusively by the Coca-Cola Company. This creates a vertical dependency that simultaneously protects both parties. The bottler’s entire capital investment is optimised for producing Coca-Cola products — their trucks, their refrigerators, their sales relationships are all built around the brand (especially goodwill and intangibles). Switching to a competing product would strand that capital investment entirely.
The demand advantage builds simultaneously in the same territory through the venue contracts. Every school canteen, every stadium pouring agreement, every fast food restaurant partnership the bottler secures places Coca-Cola at another habit-formation touchpoint for consumers in that specific area. When a teenager in that metropolitan region encounters Coca-Cola at the cafeteria, at the cinema, at the local sports venue, and at the fast food restaurant all in the same month, the cue-routine-reward loop fires repeatedly across multiple contexts. Each repetition encodes the habit more deeply.
Now the economies of scale crystallise within that territory. The bottler’s fixed production cost is spread across the habitual demand generated by that territory’s consumers via the relationships and nodes that the bottlers themselves have built. As more consumers form the habit, volume through the plant grows. The fixed cost per case produced falls. The bottler’s economics improve, which enables more aggressive bidding for new venue contracts, which places Coca-Cola in more habit-formation contexts, which deepens and widens the consumer habit base, which generates more volume, which reduces per-unit costs further. The supply advantage — exclusive concentrate relationship and production scale in that specific territory — and the demand advantage — encoded habits in the territory’s population — compound together within that specific geography to produce a cost structure that an entrant cannot achieve without solving both sides simultaneously.
A competitor entering this territory faces an exact mirror of the Amazon problem. They need to build or contract a bottling facility at the same fixed cost. But they have no existing habit to guarantee volume. Their per-case production cost is structurally higher than the incumbent’s because they have fewer cases to spread the same fixed cost across. And they cannot reduce that cost without volume, and they cannot build volume without first dislodging habits formed over decades in every major social context in the territory — which requires outbidding the incumbent bottler for the exact venue contracts the incumbent uses to maintain those habits. The bottler, operating at full scale with lower per-unit costs, can underbid for those contract renewals. The competitor is locked out not by regulation but by the arithmetic of fixed costs and volume concentration.
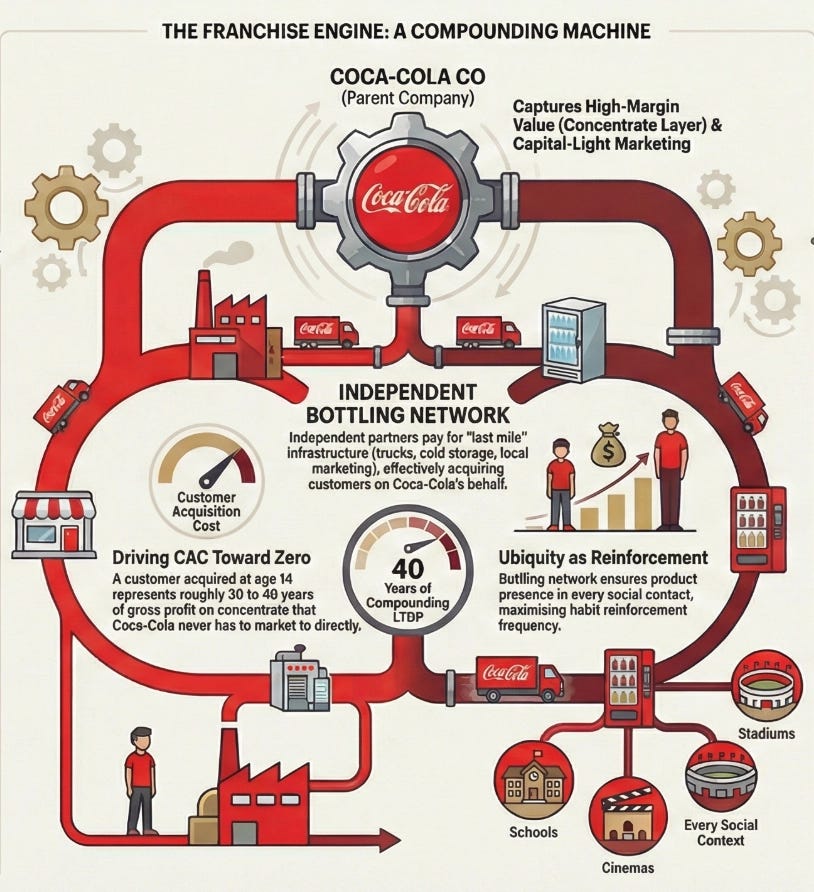
The Financial Architecture of Operating Leverage
The Coca-Cola Company’s financial numbers from the study period are the clearest possible confirmation that this local flywheel is working exactly as described.
CRR reached 42.87% in 1990 and 39.09% in 1989 — both comfortably above the 20% threshold that characterizes the strongest businesses in this study. These figures are not incidental. They reflect the concentrate-only manufacturing model: Coca-Cola Company’s asset base is focused on concentrate manufacturing, not the capital-intensive bottling, cold chain, and distribution infrastructure. That capital intensity sits entirely on the bottlers’ balance sheets.
Gross margin expanded from 57.48% in 1988 to 58.89% in 1990, while revenues grew from $8.07 billion to $10.24 billion over the same period — a 27% increase in revenue accompanied by simultaneously expanding margins. This combination is the precise signature of operating leverage working correctly. More volume flowing through a fixed-cost concentrate manufacturing base, with the savings flowing to margin rather than being eroded by proportionally growing variable costs.
Return on equity reached 35.46% in 1990 on total assets of just $6.28 billion. A business generating $1.89 billion in operating income on a $6.28 billion asset base is not achieving those returns through financial engineering. It is achieving them because the capital-intensive portions of the business — the trucks, the cold storage, the refrigerators in every retail location — are sitting on someone else’s balance sheet. Each bottler has invested their own capital to generate the demand that flows, ultimately, as concentrate revenue to Coca-Cola Company. What remained on Coca-Cola’s own balance sheet — the formula, the brand, the concentrate manufacturing capacity — generates revenue disproportionate to the capital deployed to own it. This is the franchise model expressed in its most elegant financial form.
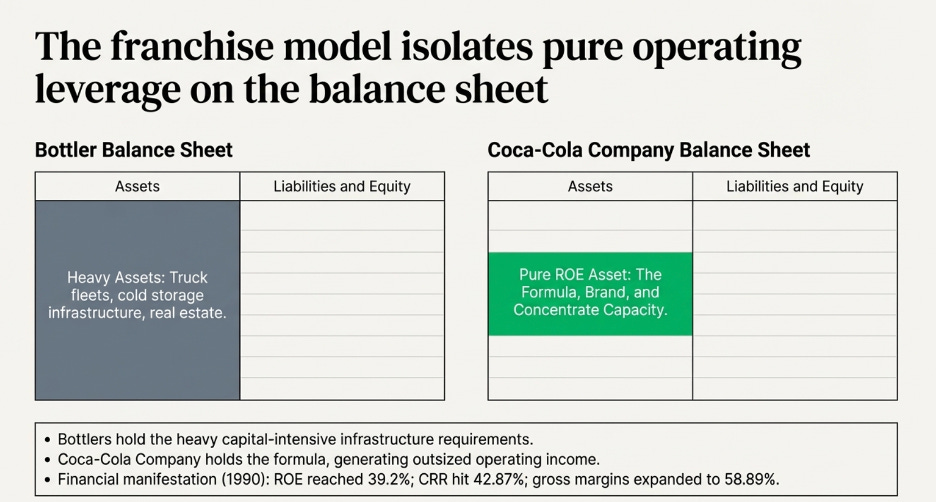
The working capital position reinforces the same picture. Concentrate is sold to bottlers on short credit terms. Coca-Cola Company holds no significant finished goods inventory — production is in concentrate form, not finished beverage. The working capital requirements of the Coca-Cola Company are structurally minimal relative to the revenues it generates. This keeps the denominator of the CRR formula lean and the numerator strong, which is precisely what you expect from a business whose economic engine is a recipe and a franchise system rather than a capital-intensive production and distribution operation.
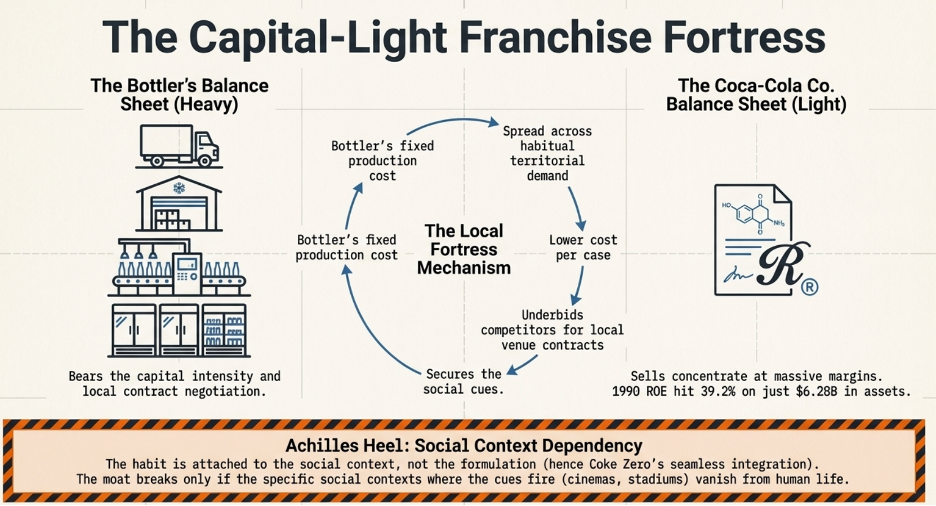
What Keeps a Competitor Out
The barrier to entry in Coca-Cola’s market is not primarily the formula or the brand in isolation. It is the combination of the habit already encoded in hundreds of millions of brains and the distribution network positioned to prevent that habit from ever finding an opening to break.
A competitor entering this market faces the demand-side barrier first: the consumers they are trying to reach have an automated purchasing response pointing toward a different product. The competitor needs to create enough of a reason for those consumers to consciously override their habit — every time the relevant cue fires — consistently enough that the new behavior eventually becomes automatic itself. This requires either a dramatically superior sensory experience or sustained exclusivity in the exact social contexts where the old habit’s cues are generated.
The competitor then faces the supply-side barrier: those social contexts — the stadiums, the cinemas, the fast food chains, the school canteens — are already under long-term exclusive contracts with the existing bottling network. The incumbent’s bottler does not need to win every renewal. They simply need to retain the venues that serve the highest-frequency habit cues — and they have every financial incentive to do so, because a venue where a competitor’s product sits is a venue where the habit loop fires with a different product for everyone inside it.
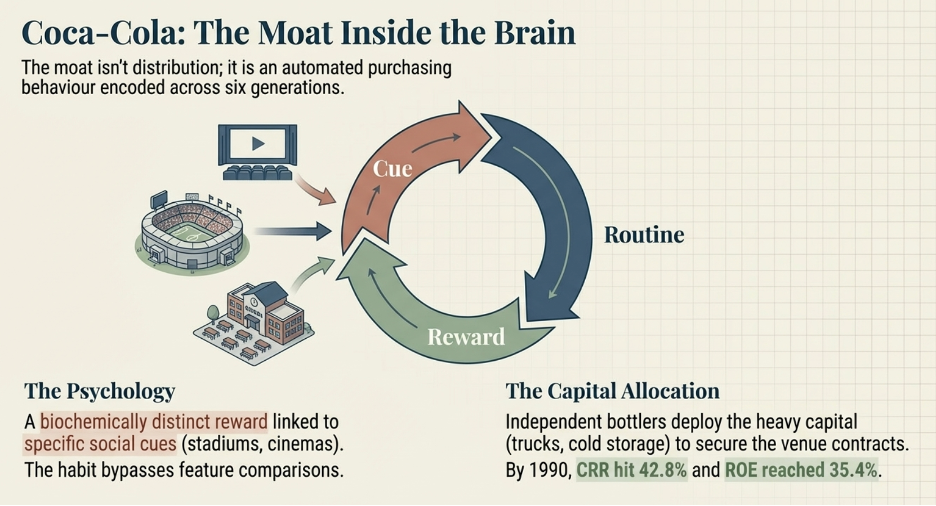
Why the Asset Is Durable
The habit is attached to the social context, not to the product formulation. This is the property that makes Coca-Cola’s moat survive health trends, generational shifts, and changing cultural attitudes toward sugar.
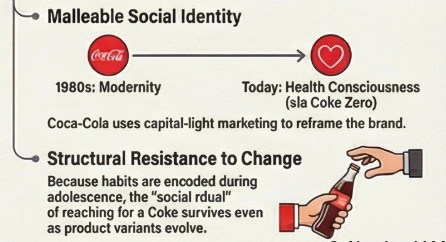
When health consciousness rose as a behavioral trend, Coca-Cola launched Coke Zero and Diet Coke. The critical decision was to keep every element of the habit infrastructure intact — the same iconic bottle shape, the same colour palette, the same sound of opening a can, the same social contexts — while adapting the formulation. The habit transferred to the new variants because the cues transferred with them. The consumer who had executed the “Coke at the cinema” routine for fifteen years did not need to develop a new habit when they switched to Coke Zero. The same cue produced the same routine. The automated behavior carried across.
The bottling network carries all variants through the same trucks and the same retail relationships. When a new variant launches, it reaches full distribution coverage within the existing network almost immediately. A competitor with a genuinely superior health-conscious formulation must negotiate its way into every cinema, every stadium, every fast food partnership independently. Coca-Cola introduces a line extension and it is everywhere within weeks.
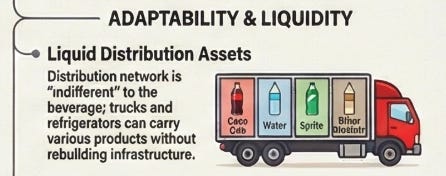
The deeper durability is that the habit is attached to a social identity signal — what it means to have a Coke in a specific moment — and that signal is actively managed and repositioned across generations using a marketing budget funded by concentrate margins. It meant modernity in the 1950s, youth in the 1980s, global aspiration in emerging markets today. The chemistry barely changed. The cultural narrative changed continuously. As long as the social contexts where the habit fires remain part of human life — celebrations, entertainment, food, sport — the cue structure that triggers the habit survives. And as mentioned above, on “customer evangelism”, this needs to be understood from a marketing perspective e.g. the specific status that the product reinforces, the problem it solves, and how it solves it (which usually takes on a psychological approach instead of a logical one, making Coca-Cola’s case so much more interesting).
BYD — The Manufacturing Moat
How BYD’s Moat Drives CAC to Below Zero
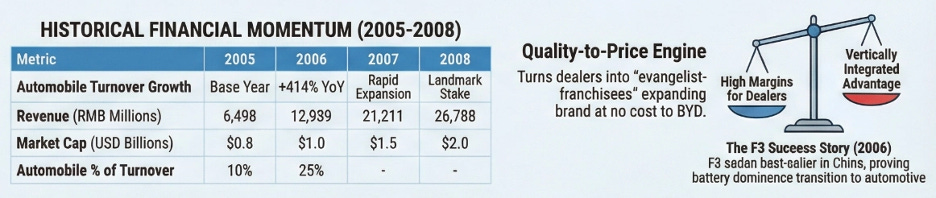
BYD’s customer acquisition economics operate through a single, classically structured mechanism: the automotive dealer franchise. BYD’s dealerships invest their own capital in showrooms, demonstration vehicles, trained sales staff, and local marketing. They bear the full cost and risk of the retail relationship — the expensive, high-touch last mile of automotive sales where a consumer needs to sit in a car, test drive it, negotiate a price, and be guided through a financing decision. BYD builds the product and the brand. The dealer network converts that brand into a customer, entirely at the dealer’s expense.
What makes BYD’s version of this model particularly compelling is the speed and confidence with which its dealer network expanded, both domestically in China and internationally. Dealers invest in BYD franchises because the product economics are compelling — BYD’s cost structure, driven by vertical integration in batteries, allows it to price competitively while maintaining margins that make the dealership economically attractive. The dealer’s confidence in the product’s competitive position is itself what drives their willingness to invest capital in the franchise, which in turn expands BYD’s distribution footprint at no cost to the manufacturer. This is the standard franchise dynamic, but it is powered underneath by BYD’s manufacturing moat rather than just brand prestige.
The Battery Supply Chain Asset: The Moat Beneath the Moat
To understand BYD’s deepest competitive advantage, you need to understand something about how manufacturing supply chains actually develop.
When BYD began as a rechargeable battery manufacturer in 1995 — making nickel-cadmium and lithium-ion batteries for mobile phones and consumer electronics — it was building something far more valuable than a product line. It was building volume relationships with raw material suppliers, component manufacturers, and process equipment vendors who form the backbone of any battery supply chain. These relationships are not casual commercial arrangements. They are deeply operational partnerships where suppliers invest in capacity, tooling, and process knowledge specifically calibrated to your production requirements. A supplier who has spent years engineering their output to your specifications, and who depends on your volume for their own economics, is not a supplier you can replicate overnight. They are part of your moat.
When BYD decided to enter the automobile business, it did not face the supply chain construction problem that confronted every other automaker attempting to pivot to EVs. Traditional automakers — Ford, GM, Volkswagen — spent over a century building supply chains optimised for combustion engines. When electrification arrived, they faced the brutal challenge of dismantling one supply chain and constructing an entirely different one, competing for battery materials and manufacturing capacity in a market where BYD already had entrenched relationships, proven volume, and supplier loyalty built over decades.
Battery supply chain access is not simply a question of being willing to pay. It is a question of volume credibility. Lithium, cobalt, and nickel suppliers all allocate their capacity preferentially to customers who can guarantee large, consistent, long-term volumes. BYD’s traditional battery business gave it that volume credibility before its automotive business needed it. A new EV entrant — even a well-funded one — must negotiate supply allocation against BYD’s existing claims on that capacity, often paying higher prices for smaller quantities on shorter contract terms. This is a structural cost disadvantage that cannot be solved simply by spending more money.
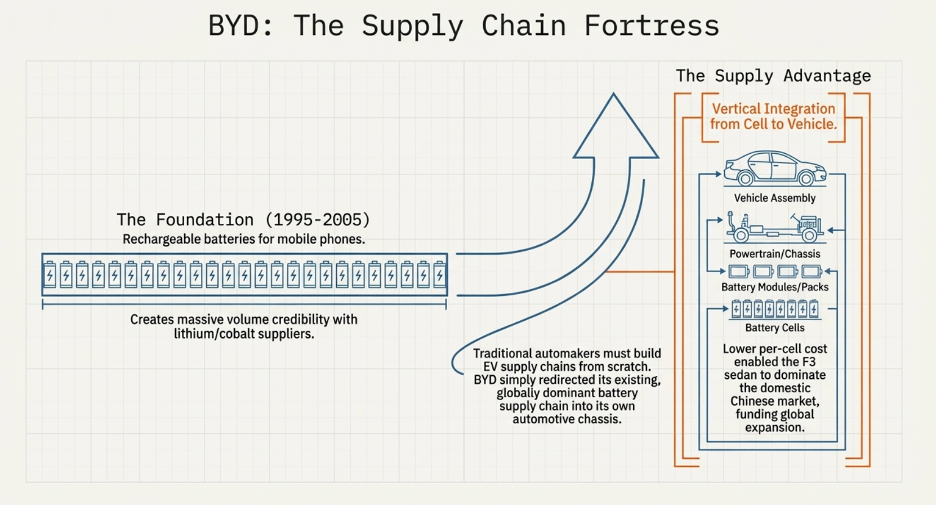
How the Local Chinese Market Turned Supply and Demand Into a Global Platform
BYD’s local flywheel operated at two levels simultaneously: within China’s mid-price automotive market and within the regional battery supply chain centered on Chinese suppliers.
In China, BYD’s supply advantage — vertical integration from battery cell to finished vehicle — translated into a cost structure that no traditional automaker could match in the domestic market. This wasn’t theoretical. The F3 sedan became the best-selling domestic Chinese automotive brand in 2006, delivering competitive quality at a price that imported or joint-venture brands couldn’t touch. That specific local success — selling cars to Chinese middle-class buyers who wanted domestic alternatives to expensive foreign brands — generated the volume BYD needed to deepen its supplier relationships and reduce per-unit battery costs further.
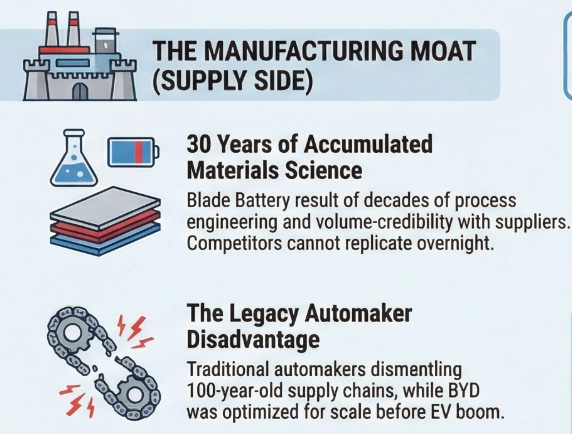
The demand advantage in China was dealer confidence (albeit a weak advantage resulting more from its superior product, a result of its supply advantage). As dealers watched the F3 sell consistently, they invested more capital in BYD showrooms, stocked more demonstration vehicles, and trained more sales staff. More showrooms meant more consumer exposure, which generated more sales, which reinforced dealer conviction, which attracted more dealers. BYD never had to deploy retail capital of its own — the demand-side success in the Chinese market caused the distribution infrastructure to build itself, funded entirely by dealers betting on BYD’s product quality.
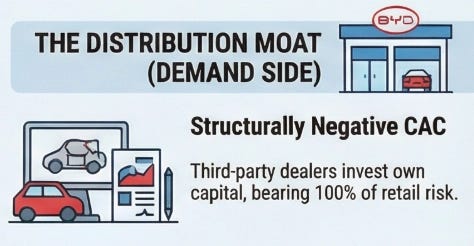
Here is where the economies of scale emerged from this specific local concentration. Higher domestic volume in China meant higher battery production runs. Higher production runs meant lower per-cell cost. Lower per-cell cost meant BYD could price the vehicle more competitively, which deepened dealer conviction, which expanded distribution, which generated more sales volume, which drove per-cell costs down further. The supply advantage — vertical integration economics — and the demand advantage — dealer franchise investment driven by genuine product conviction — compounded together in the specific context of the Chinese mid-price car market to produce a cost-to-quality ratio that incumbents structurally could not match without dismantling and rebuilding their own supply chains.
The local Chinese dominance was not just a starting point. It was the proof-of-concept that made international expansion viable without BYD bearing the retail capital risk. Once the economics were validated domestically, international dealers could observe the Chinese market performance and invest their own capital in BYD franchises globally. The local flywheel became the template that exported itself.
A Different Kind of Investment Logic: Munger’s Optionality Framework
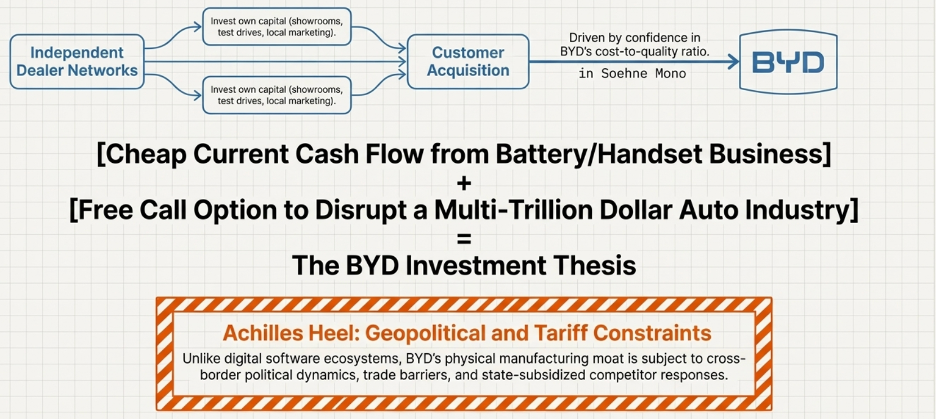
This is the point (and the most important takeaway from this case study) where BYD’s investment thesis diverges fundamentally from the other four companies in this analysis, and the divergence requires intellectual honesty to state clearly.
For Apple, Amazon, Google, and Coca-Cola, the LTGP:CAC analysis is the central value driver. The moat is primarily about how much gross profit each customer generates over their lifetime, and how structural barriers ensure those customers stay, and how much of operating leverage the business has to scale fast. These are businesses where the core economics are mature and the compounding is well-established.
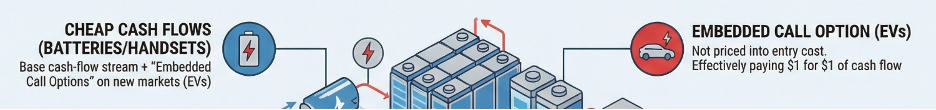
BYD is a different animal entirely. Charlie Munger framed this class of investment precisely: cheap current cash flow plus massive optionality. The traditional battery and handset components business — the one that generated the supply chain relationships and the manufacturing expertise — was the “cheap current cash flow” part. It was a real, profitable business generating predictable returns. But the optionality it created — the ability to enter the automobile industry with a cost structure and supply chain advantage that no traditional automaker could match — was worth multiples of the cash flow business on its own. Munger was not primarily paying for BYD’s current earnings. He was paying for the right to participate in BYD’s ability to disrupt a multi-trillion dollar industry from a position of genuine structural advantage, at a price that reflected none of that optionality (in other words, a Long Call option).
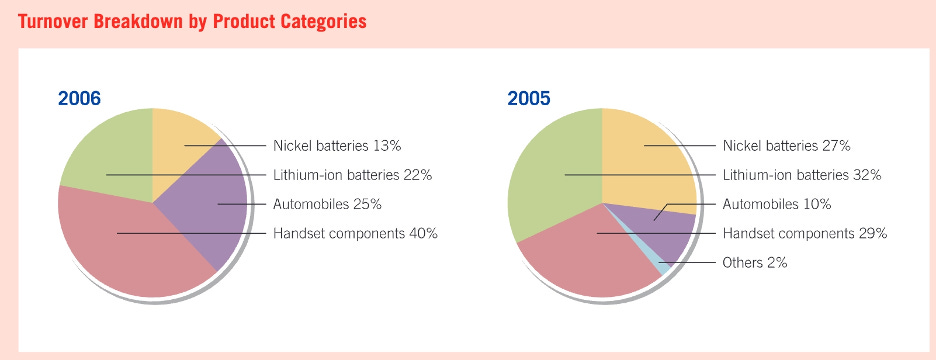
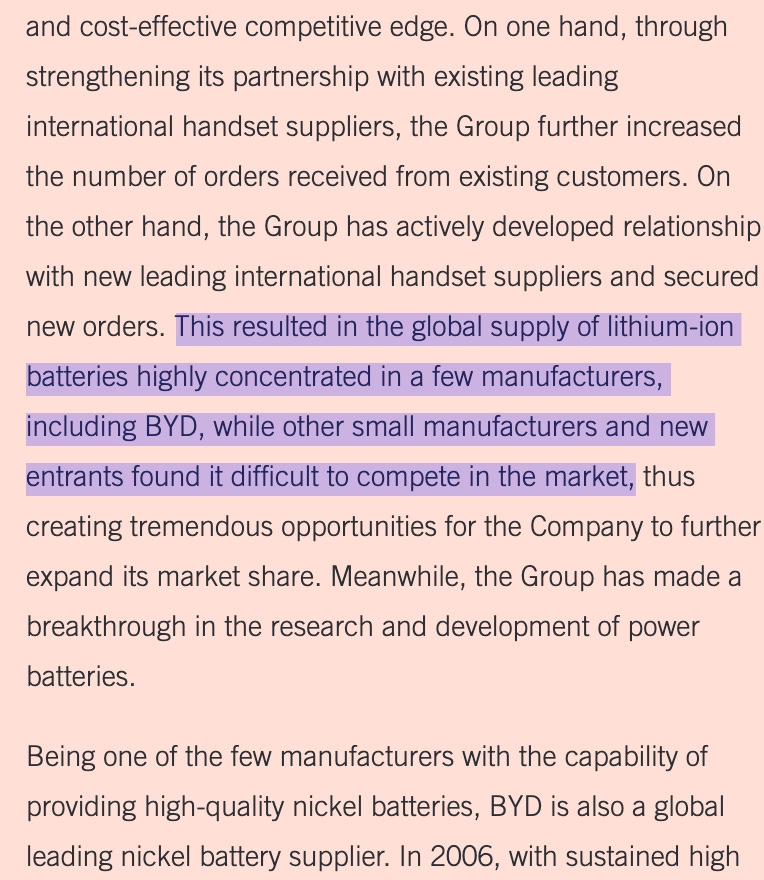
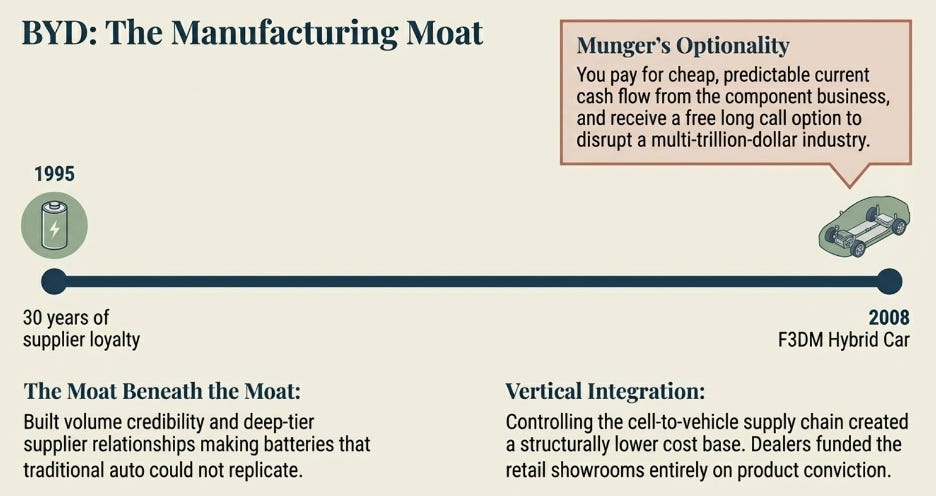
Part Five: The Manager Is the Investment
What Nobody Reads in the Annual Report
Every public company is legally required to disclose, in precise detail, exactly how its senior executives are compensated — the metrics, the instruments, the vesting timelines, the performance thresholds. This is published every year and available to anyone who reads the proxy statement.
Almost nobody reads it.
This is a significant mistake, because the compensation structure answers a question that no earnings call or strategy presentation ever will directly: what decisions will these people actually make when short-term and long-term are in conflict? When the market is pressuring them to cut investment to protect this year’s margin? When a bold multi-year bet requires absorbing costs that will suppress reported earnings for several years?
The answer to those questions is not in the CEO’s vision statement. It is in how their personal wealth moves in response to the decisions they make.
Munger said this plainly: show me the incentive and I will show you the outcome. He repeated it throughout his career because it kept being true. Every company in this study had a compensation structure that, read carefully at the entry point, would have predicted the most important strategic decisions management subsequently made.
Before going company by company, it helps to understand what a performance metric actually does to a human being. A metric is not a neutral measurement tool. It is a behavioral signal. The moment you tell someone that a number determines their personal financial outcome, they begin — consciously or not — making decisions that protect and improve that number. The question a board must ask is not “what metric best captures our performance?” but “what behavior will this metric produce in the people we are paying?” Those are often very different questions, and the companies in this study answered the second one more carefully than almost anyone else in corporate history.
Apple: Profitable Growth, Measured on Economic Reality
Steve Jobs drew a salary of $1 per year. No new equity grants. No performance bonuses. His only financial instrument was approximately 5.5 million Apple shares he already held. There was no near-term number he was being paid to hit. Every decision he made had a single financial consequence: what does this do to Apple’s long-term stock price?
For the executive layer below Jobs, Apple used a Performance Bonus Plan built on two metrics measured together: Adjusted Net Sales and Adjusted Operating Income.
Understanding why these two metrics were paired, and why both were “adjusted,” tells you almost everything about what Apple’s board was trying to produce.
Start with the pairing. Net Sales alone would incentivise revenue growth at any cost — including margin-destroying discounts, reckless product launches, or market share bought through giveaways. An executive chasing a Net Sales target has every reason to sell more units even if those units are barely profitable. Operating Income as a counterweight fixed this directly: growth only counted if it was profitable growth. You could not hit your bonus by giving product away. The two metrics work like a pair of guardrails — one ensures the business is growing, the other ensures the growth is worth having.
Now understand why both were “adjusted.” Apple at this time recognised iPhone and Apple TV revenue under subscription accounting — spreading the revenue over 24 months rather than recognising it all at the point of sale. This created a significant gap between reported GAAP revenue and the actual economic activity happening in the business. In a record-breaking product year, GAAP revenue could be as much as 45% lower than the cash that had actually been generated. If bonuses were tied to GAAP metrics, a manager who executed a brilliant product launch would see their “win” arrive in the reported numbers only two years later. The incentive to execute brilliantly today would be muted. Worse, it would create an incentive to smooth and manage reported numbers rather than to actually run the business well.
Apple stripped out this distortion and paid management on the underlying economic reality: cash-basis adjusted sales and the operating income flowing from them. The principle behind this — that management should be incentivised on the economic reality of the business, not the accounting presentation of it — is pure Munger. It meant Apple’s executives were running the real business, not the reported one.
The equity structure reinforced this. Named Executive Officers received roughly 85% of their total compensation in RSUs, with four-year cliff vesting — nothing at all until year four, then everything. Cash bonuses were deliberately small, capped at 100% of base salary versus the 125% to 150% common at peer firms. The message embedded in the structure was unambiguous: Apple does not pay you to hit this year’s number. Apple pays you to build something that is worth more in four years than it is today.
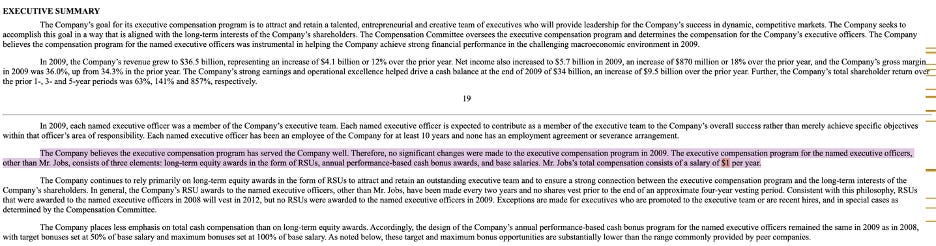
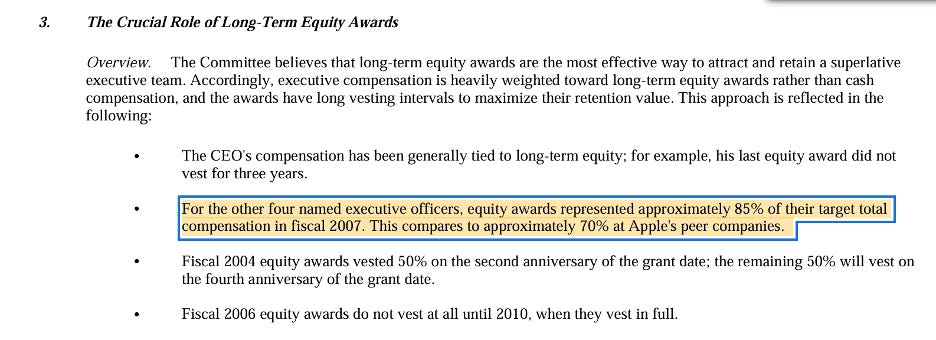
Between 2006 and 2012, Apple launched the iPhone, the App Store, and the iPad and became the most valuable publicly traded company in history. CRR expanded from 48.83% to 76.88%. ROE grew from 26% to 36%. You did not need to inspect Apple’s strategy documents to predict this outcome. You only needed to read the compensation plan.
Alphabet: Relative Total Shareholder Return Against the Entire World

Larry Page and Sergey Brin maintained $1 annual salaries and received no new equity grants throughout the analysis period. Their personal financial outcomes were determined entirely by whether Alphabet remained one of the most dominant businesses on earth. On the other hand, Sundar Pichai’s structure, formalised when he became unified CEO in 2019, was built around a single metric: Relative Total Shareholder Return against the S&P 100 — the 100 largest companies across the entire global economy, measured over a three-year performance period.
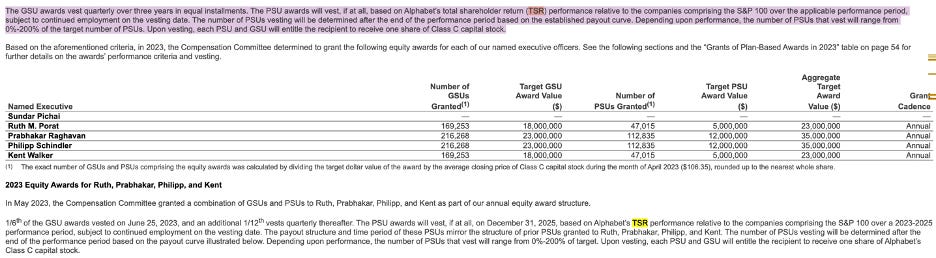
To understand why this specific metric matters, you need to appreciate what it does that most executive compensation metrics don’t.
Most technology companies benchmark their CEOs against a narrow group of 10 to 15 comparable technology peers. This structure contains a hidden escape hatch: if the entire technology sector has a bad three years, the CEO can still receive a full payout by doing slightly less badly than their peer group. The metric rewards relative outperformance within a category, not excellence in any absolute sense. A CEO measured against tech peers is incentivised to be good at being a technology company. A CEO measured against the S&P 100 is incentivised to be one of the most competitively excellent businesses on earth, full stop — better than the best banks, the best consumer goods companies, the best healthcare businesses, the best of everything. Additionally, these technology companies often neglect shareholder’s return, resulting in massive dilution — which in Alphabet’s case, was not present since they’ve highlighted a focus on returns for shareholders.
The payout structure attached to this benchmark had one critical feature: performance below the 25th percentile of the S&P 100 triggered complete forfeiture. Not a reduced payout. Zero. This is not a sliding scale that gently reduces as performance softens. It is a cliff. Underperform the bottom quarter of the most powerful companies on earth, and every dollar of Pichai’s performance-linked compensation disappears entirely. This was not designed to motivate incremental improvement. It was designed to make mediocrity personally catastrophic.
Alphabet also eliminated annual cash bonuses for Named Executive Officers entirely in March 2015. Over 99% of Pichai’s variable compensation was delivered in multi-year equity. By doing this, the board severed the psychological connection between “how did this quarter go?” and “how much did I earn this year?” An executive with no cash bonus has no financial reason to manage any quarterly number. Their wealth moves only with the stock price, and only over a multi-year horizon. This is the decision-making environment that produces willingness to absorb years of near-term investment costs for long-duration bets. The board was also deliberately increasing the proportion of Pichai’s compensation tied to this harder-to-earn performance structure over time — PSU allocation grew from 43% of his equity grants in 2019 to 60% by 2022. As Alphabet grew larger and the stakes of capital allocation decisions grew correspondingly larger, the board tightened the performance linkage rather than loosening it. That structural change in incentive itself is a signal.

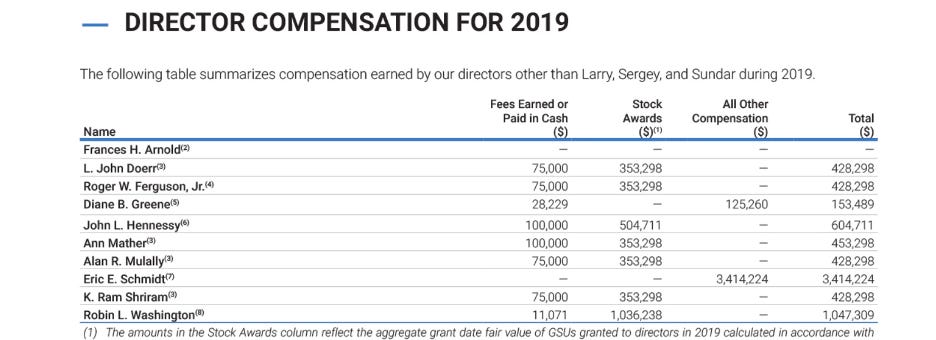
Over the 2019–2022 measurement period, Alphabet’s TSR reached 203.65%, placing it at the 92.86th percentile of the S&P 100. It outperformed 92 out of every 100 of the most powerful businesses in the world across three years that included a global pandemic. The compensation structure did not produce this result by itself — but it created the environment in which the investments behind this result were financially rational choices for the people approving them.
Amazon: The Metric Was the Absence of a Metric
Jeff Bezos drew a base salary of $81,840 in 2005. He received no bonuses and no new equity grants. His only financial instrument was an ownership stake of approximately 24 to 25% of Amazon. The only rational strategy, given that concentration, was patience.
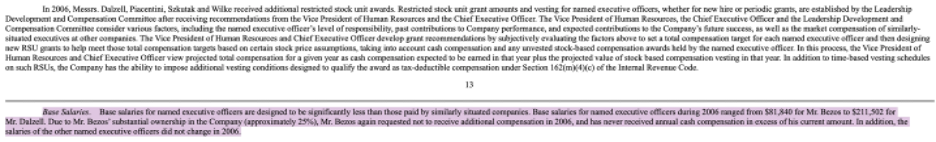
Amazon’s executive compensation philosophy during this period is most revealing not for what the board chose to measure, but for what they explicitly refused to measure. The Leadership Development and Compensation Committee made a deliberate decision to establish no performance-based cash bonus opportunities for Named Executive Officers whatsoever.
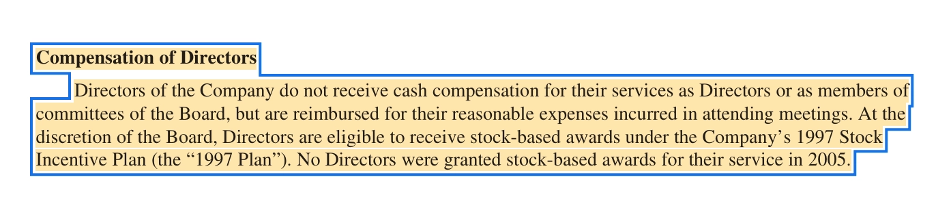
This requires explanation, because the standard corporate governance instinct runs exactly opposite. Tie pay to metrics, and managers will deliver on those metrics — or so the logic goes. Amazon’s board understood the flaw in this logic. A management team with a meaningful cash bonus tied to this year’s operating margin will, consciously or not, make capital allocation decisions that protect that margin. The multi-year infrastructure investment required to build FBA, the cost of acquiring and retaining Prime members before that model was proven, the long-horizon bet on new product categories — none of these decisions are comfortable to make when your personal cash compensation is hostage to next year’s profitability number. Each of them required accepting margin compression for years before any payoff was visible.
By removing performance-based cash bonuses entirely, Amazon’s board removed the conflict of interest. They were restructuring the incentive so that the long-term investment and the personal financial outcome pointed in the same direction.
The metric that replaced all of this was effectively a single, implicit one: long-term stock price appreciation, expressed through a back-loaded RSU vesting schedule that concentrated 80% of an executive’s equity value in years three and four, and only 20% of the value within the first 2 years. The financial cost of departure was engineered to not only optimize for long-term decisions, but also be maximally painful at exactly the point when an executive had accumulated enough institutional knowledge to be most valuable to a competitor.
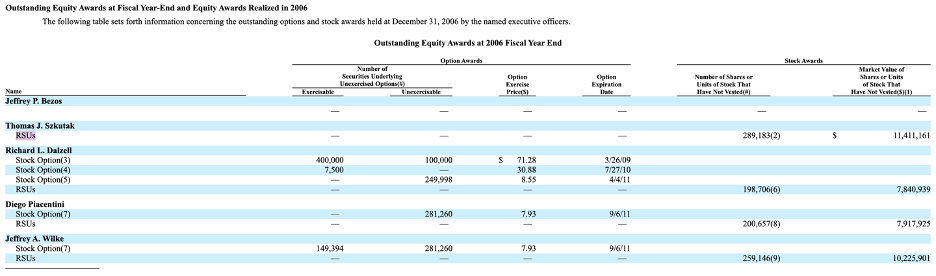
By 2005, the unvested equity holdings of key executives were valued at over 100 times their annual salary — a ratio that effectively erases the distinction between professional manager and founder. When your unvested equity is worth 100 times your salary, you are not an employee with equity upside. You are an owner with a salary stipend. And the only question that matters to an owner with no diversification is: what will make this business worth more in four years?
The sign-on bonuses used to bridge the early vesting years were deliberately fixed rather than performance-contingent — another precise design decision. A performance-contingent bridge payment would reintroduce exactly the short-term metric focus the board was trying to eliminate. A fixed sign-on bonus provides liquidity without creating behavioral distortion.
Between 2003 and 2007, Amazon introduced Prime and developed FBA into a national fulfillment infrastructure. Each initiative compressed reported margins for years before paying off. These decisions did not require extraordinary vision or courage. They required only that the people making them were answering the question their compensation structure put in front of them every day: what will make Amazon’s stock worth more in four years than it is today?
Not to forget (during our period of analysis), although Amazon was the only company which did not experience significant buybacks (accretion), there were no significant dilution of shareholder value either.
Coca-Cola: Return on Equity, Stripped of Every Excuse
Roberto Goizueta’s genius was structural, not motivational. He did not ask his managers to care more. He built a system where the mathematics of personal wealth made caring and performing the same action.
The primary performance metric at Coca-Cola during this period was Return on Common Equity (ROE), measured alongside Operating Income per Share — and crucially, both figures were deliberately stripped of nonrecurring items like the 1989 Columbia Pictures sale.
To understand why ROE was the right metric and why stripping nonrecurring items mattered so much, you need to understand what ROE actually measures and what it prevents.
ROE asks one precise question: for every dollar of equity that shareholders have left in this business, how much profit did management generate? It is a measure of capital efficiency. A management team chasing revenue can grow the top line through acquisitions that destroy economic value, through pricing concessions that buy volume at the cost of margin, or through geographic expansion into markets that never earn their cost of capital. All of these moves can make revenue look impressive while actually making the business worse. ROE exposes all of them. If you deploy equity and the returns on that equity fall, ROE falls regardless of what the top line is doing.
Stripping nonrecurring items prevented a further distortion. A management team with the Columbia Pictures asset could have sold it, booked a large one-time gain, and produced a spectacular ROE figure in the year of the sale — while contributing nothing to the sustainable earning power of the underlying business. By excluding these events from the bonus calculation, the board ensured that management was paid for the operating quality of the business itself, not for financial events that had nothing to do with running it better. The only way to improve a stripped, adjusted ROE consistently over time is to genuinely improve the business.
The at-risk structure that enforced these consequences was unforgiving. Between 1985 and 1988, Coca-Cola established compensation programmes tying the personal financial outcomes of key officers to appreciation in a combined 1.7 million shares above a fixed base price of $10.31 per share. These structures paid precisely nothing unless the stock moved above that base price. A stagnant stock made the entire structure worthless for every officer in the programme regardless of how well the business had performed relative to competitors. There was no salary-plus-bonus cushion softening the downside. Every dollar of personal wealth these executives held in these instruments was contingent on delivering genuine, compounding equity value.
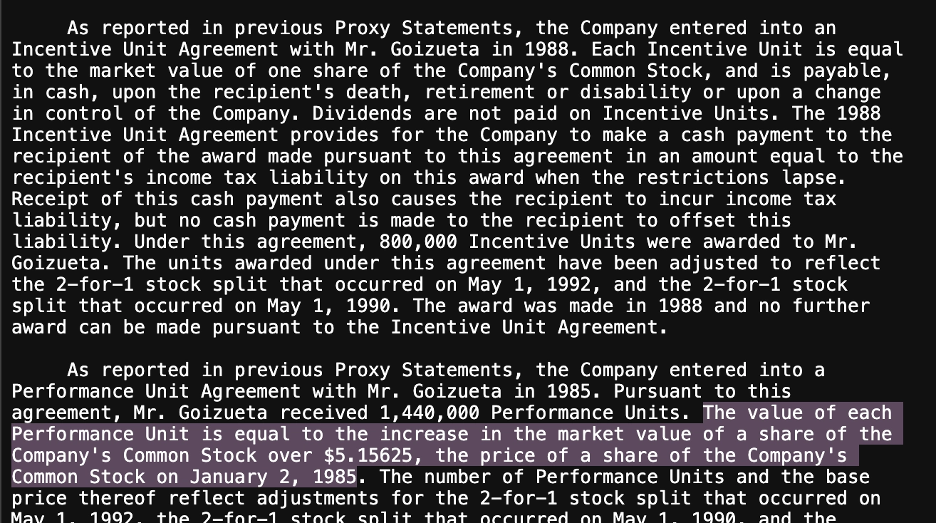
The behavioral consequence of this was immediate and vivid. When the Berlin Wall fell in November 1989, Coca-Cola had product moving into eastern Germany within days. Twenty-one million unit cases were sold in the region within the first year. That is not a company following a strategic planning process. That is a management team that understood immediately that 16 million consumers who had never formed the Coca-Cola habit had just become accessible — and that every day of delay was a permanently foregone opportunity that would never show up in their personal financial position again. When 1.7 million units of your personal wealth sit above a fixed strike price and a market of 16 million new potential consumers appears overnight, you do not need a mission statement to focus your attention. The mathematics of your own net worth does it for you.
By 1990, ROE reached 39.2% — the highest in more than 50 years. Operating income per share grew 22% year-over-year. The income generated by Coca-Cola in 1990 alone exceeded the total market capitalisation of the entire company in 1981. These are not outcomes that were delivered by motivational culture or inspirational leadership alone. They were produced by a compensation structure that made the efficient deployment of capital and the expansion of operating profits the only rational path to personal wealth.
That is the Munger axiom in its purest form.
BYD: Ownership as the Only Metric
Wang Chuan-fu’s compensation structure requires the least explanation and contains the deepest lesson.
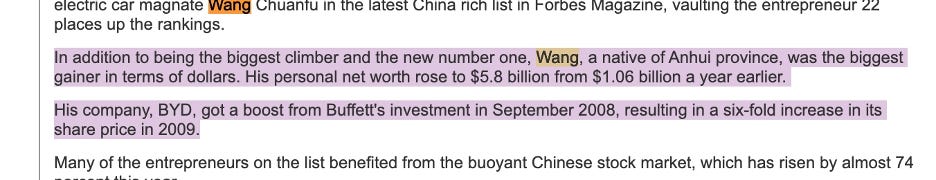
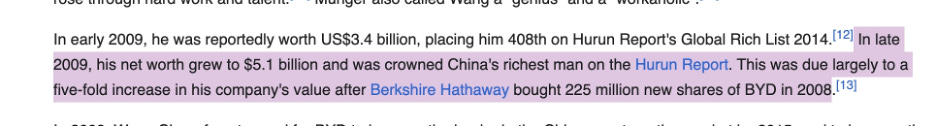
There was no formal metric. There was no performance bonus programme. There was no Western-style compensation architecture of any kind. Wang’s personal wealth was overwhelmingly concentrated in BYD equity — shares held directly. The only thing that determined his financial outcome was the long-term appreciation of BYD as a business. The metric was the stock. Everything else was simply a way of asking the same question: is this decision good for BYD in ten years?
In 2008, during the global financial crisis, BYD’s net profit margin collapsed from 19% to 9%. Wang used that year to launch the F3DM — the world’s first mass-produced plug-in hybrid. A professional manager whose personal cash income depends on protecting this year’s reported profitability does not voluntarily compress margins by 10 percentage points during a global financial crisis to fund a product launch into an unproven market. That decision looks irrational against any short-term metric. Against a single long-term one — is this good for BYD in ten years? — it was obvious.
BYD’s market capitalisation was approximately $2 billion at the time of Berkshire’s investment in 2008. At its peak the company exceeded $100 billion. The incentive structure that produced this trajectory can be stated in one sentence: Wang Chuan-fu’s compensation was his ownership of the business.
The Pattern Across All Five
Read the five compensation structures together and a single principle emerges from each one, expressed differently but pointing in the same direction.
Apple measured profitable revenue growth on the economic reality of the business, paired two metrics to prevent gaming either one in isolation, and tied 85% of equity to a four-year cliff that made the near term financially irrelevant. Alphabet measured performance relative to the entire global economy rather than a comfortable peer group, installed a forfeiture cliff that made mediocrity personally catastrophic, and eliminated cash bonuses so that quarterly results had no bearing on personal wealth. Amazon removed annual performance metrics entirely, because every annual metric creates an incentive to manage that metric at the expense of long-term investment, and concentrated 80% of equity value in years three and four. Coca-Cola chose the one metric — ROE stripped of nonrecurring noise — that cannot be gamed through financial engineering and can only be improved by genuinely deploying capital more efficiently, then tied 1.7 million units of personal wealth to appreciation above a fixed price with no floor and no safety net. BYD eliminated the distinction between metric and ownership entirely. When your entire net worth is the stock, the metric is the business itself.
In every case, the person most responsible for long-term capital allocation had significant personal financial outcome tied to the long-term equity value of the business, with no meaningful competing incentive pointing toward the near term. In every case, this produced decisions that required absorbing near-term cost in exchange for long-term value.
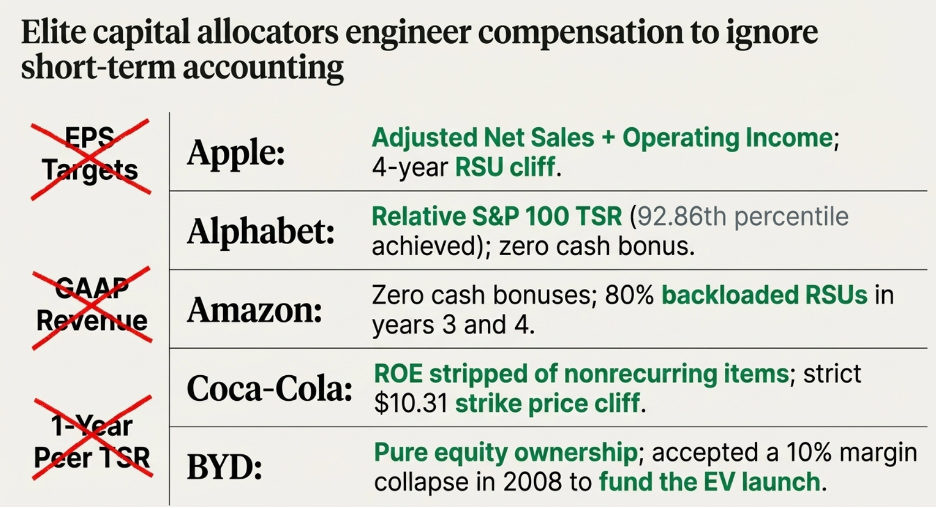
What the Numbers Tell You — And What They Cannot
Step back from the five companies and look at what they share on paper. All five, at the point of study, generated a Cash Reinvestment Rate of at least 20% — the threshold that separates businesses genuinely compounding their capital base from businesses merely reporting profits. All five sustained a Return on Equity above 20%, confirming that the compounding was real and not manufactured through financial leverage. All five were large-cap businesses at the time of analysis, with the liquidity and size which institutional capital deployment requires. All five traded at a Price-to-Sales ratio below six, and for most, a PE which provided a margin of safety relative to the duration of which the company’s current performance would last — the guardrail that prevents you from paying so far ahead of economic reality that even a correct thesis on the business produces a poor investment outcome.
These metrics form the quantitative screen. They are the filter that separates businesses worth studying deeply from the thousands that are not. A business that fails any one of them is telling you something important: either it is not compounding efficiently, or you are already paying for everything the compounding will produce. Both outcomes are fatal to long-term returns.
There are criteria that do not make the cut across all five — dividend policy, debt-to-equity ratios, specific working capital structures. These vary meaningfully across the companies and reflect the different capital structures appropriate to each business model rather than any shared principle. What does overlap, beyond the four primary metrics, is strong operating cash flow conversion — the confirmation that reported earnings are real cash, not accounting constructions. That matters, but it is downstream of the four metrics rather than independent of them.
Pass the quantitative screen and you have identified a candidate. What you have not yet done is the most important part of the work.
Where Science Ends and Art Begins
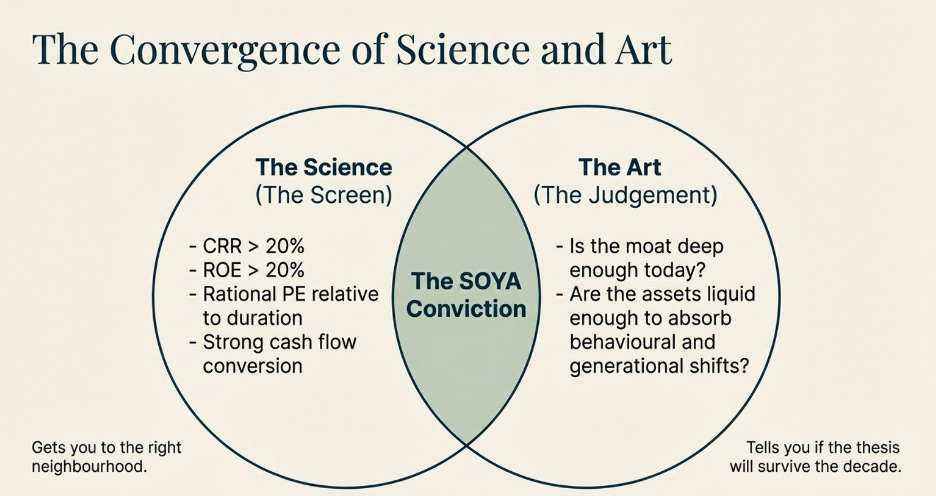
The quantitative screen tells you which businesses are worth your serious attention. It tells you nothing about whether the performance that produced those numbers will persist — for five years, for ten, for thirty. That question cannot be answered with a formula. It requires judgment, and judgment of a specific kind: the ability to look at the source of a business’s competitive advantage and assess honestly whether it will still be intact when the world looks different than it does today.
This is where the moat analysis lives. And this is where investing becomes more art than science.
A CRR of 48% tells you Apple was compounding powerfully in 2009. It does not tell you whether the App Store flywheel — developers funding the ecosystem, users accumulating switching costs, Services revenue layering on top — would survive a shift in which device people built their digital lives around. That judgment required understanding the mechanism of the moat well enough to identify its specific vulnerability: not the product, not the brand, but the device. The numbers confirmed the compounding. Only the qualitative analysis revealed what could break it.
A ROE of 39% tells you Coca-Cola was deploying capital with extraordinary efficiency in 1990. It does not tell you whether the habit encoded in hundreds of millions of brains — the automatic reach for a Coke at the cinema, at the stadium, at the fast food counter — would survive generational shifts in health consciousness and cultural attitudes toward sugar. That judgment required understanding that the habit is attached to the social context, not the formulation, and that the bottling network carries line extensions through the same trucks and the same venue relationships without rebuilding anything. The numbers confirmed the machine was working. Only the qualitative analysis revealed why the machine would keep working.
BYD’s CRR of 11% in 2019 would have disqualified it under a mechanical application of the screen. The art was recognizing that the screen was measuring the wrong thing — that the battery manufacturing business was not the investment thesis, it was the evidence that the investment thesis was credible. The real asset was 30 years of supply chain relationships, volume credibility with raw material suppliers, and manufacturing expertise that gave BYD a structural cost advantage in electric vehicles that no traditional automaker could replicate without dismantling and rebuilding their entire supply chain. Munger saw this. He was not paying for current cash flows. He was paying one dollar for one dollar of current cash flow and receiving the optionality to disrupt a multi-trillion dollar industry for free. The numbers, read correctly, were the entry point. The judgment about the optionality was the thesis.
The Complete Framework
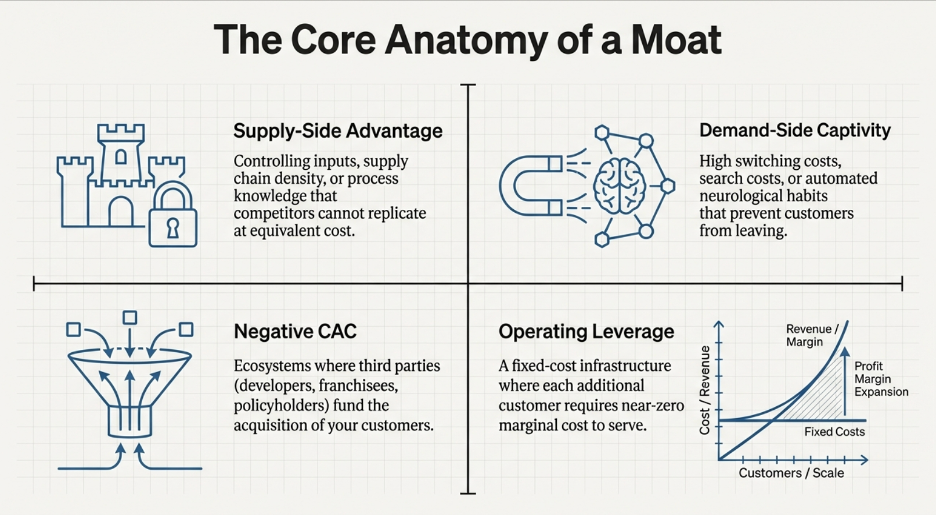
The moat tells you whether the competitive position can be sustained. The CRR and ROE tell you whether the financial mechanics validate that thesis — whether the business is genuinely converting its competitive advantage into compounding capital. The compensation structure tells you whether the people running the business are aligned to steward those advantages across decades, or whether they have enough salary, enough near-term equity, and enough annual bonus to make the comfortable short-term decision when the right long-term decision is hard. And the valuation — the price relative to what you believe the business is genuinely worth — tells you whether you are entering at a price that gives the thesis room to breathe or one that requires perfection to produce an acceptable return.
All four lenses, pointed at the same business at the same moment, is what a complete investment thesis looks like.
The quantitative screen gets you to the right neighborhood. Understanding the moat — its mechanism, its durability, the specific conditions under which it breaks — is what separates a thesis from a hunch. These two things together, held with the patience that the compensation structures of these five managers modeled so precisely, is the practice.
It is not a formula. Formulas are replicable. If investing were a formula, the returns would be competed away the moment the formula became known. What makes it durable as a practice is exactly what makes it difficult: the judgment required to distinguish a moat that will persist from one that merely looks like it will, at a moment when the market has not yet made the same determination.
Finding a business that passes the screen, that has a moat you genuinely understand, whose durability you can defend with specificity, run by people whose financial interests are inseparable from the long-term health of the enterprise, purchased at a price that does not require the future to be perfect — that is rare.
When you find it, buy it at a sensible price.
Then sit on your ass.
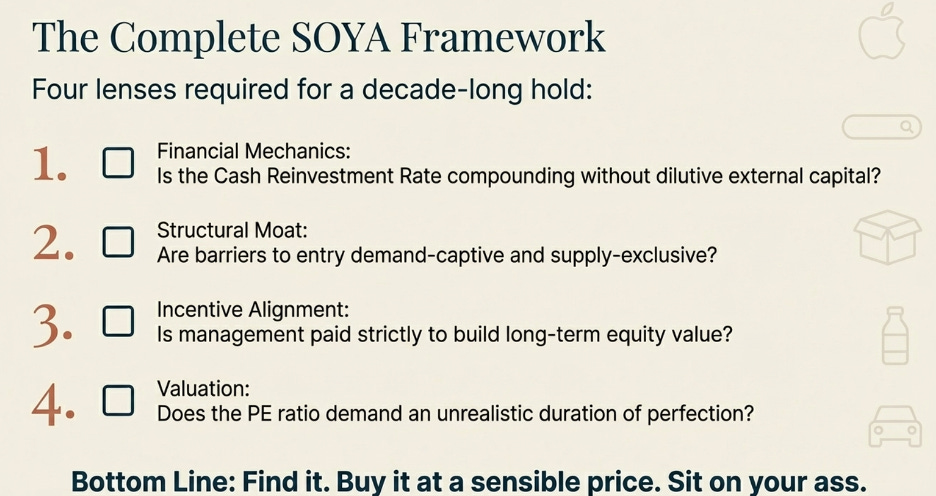
Data Associated To Insights Mentioned In This White Paper
Apple Inc Key Metrices
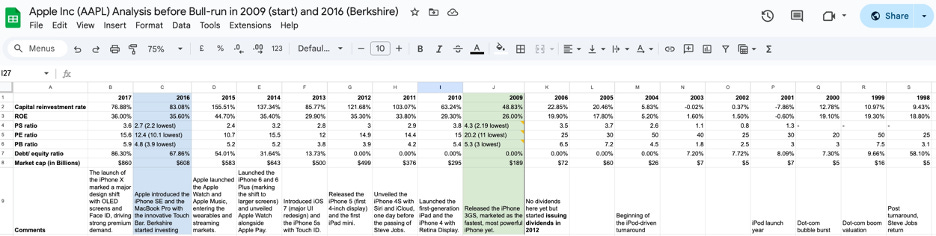
Alphabet Inc Key Metrices
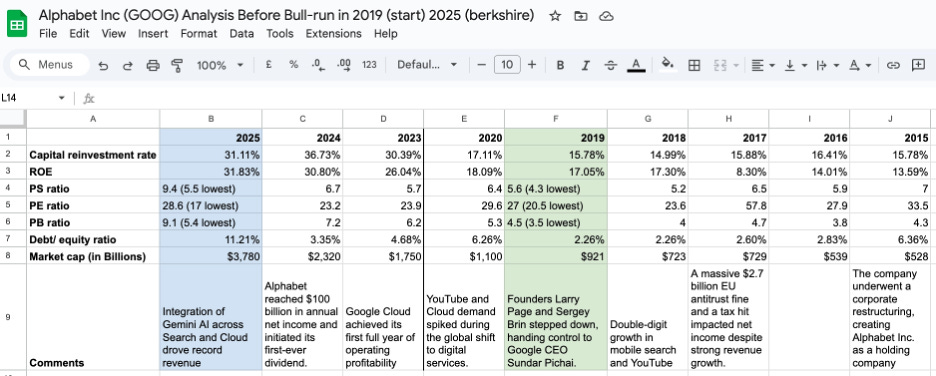
Amazon.com Inc Key Metrices
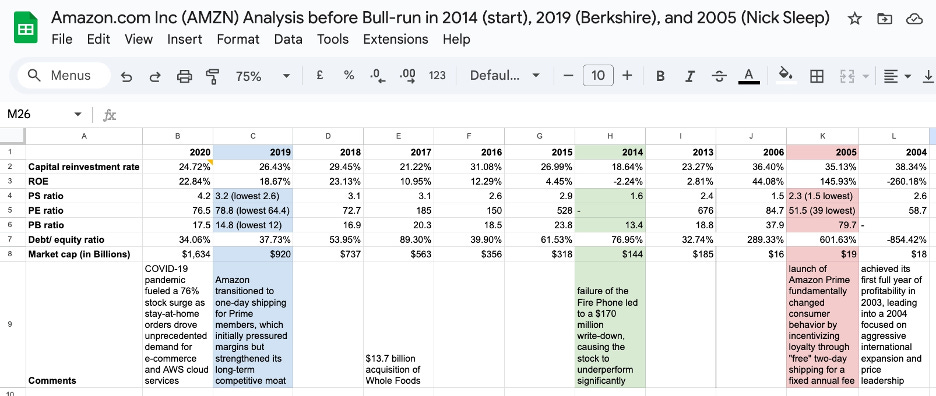
Coca Cola Co Key Metrices
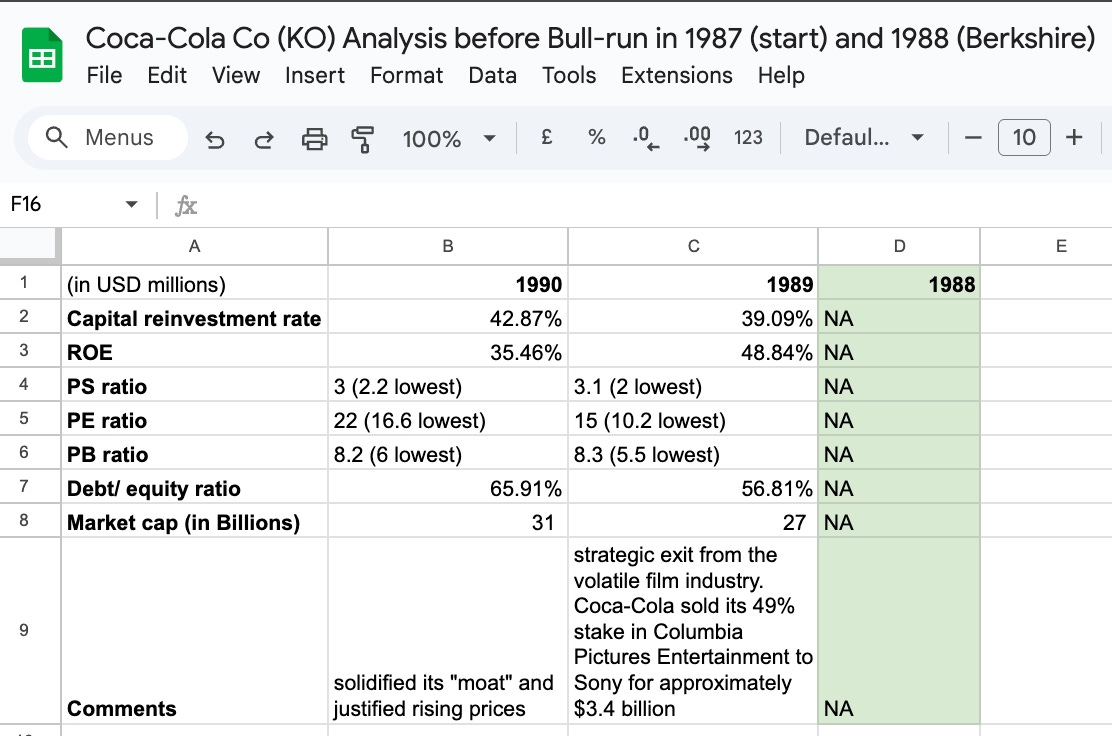
BYD Company Key Metrices
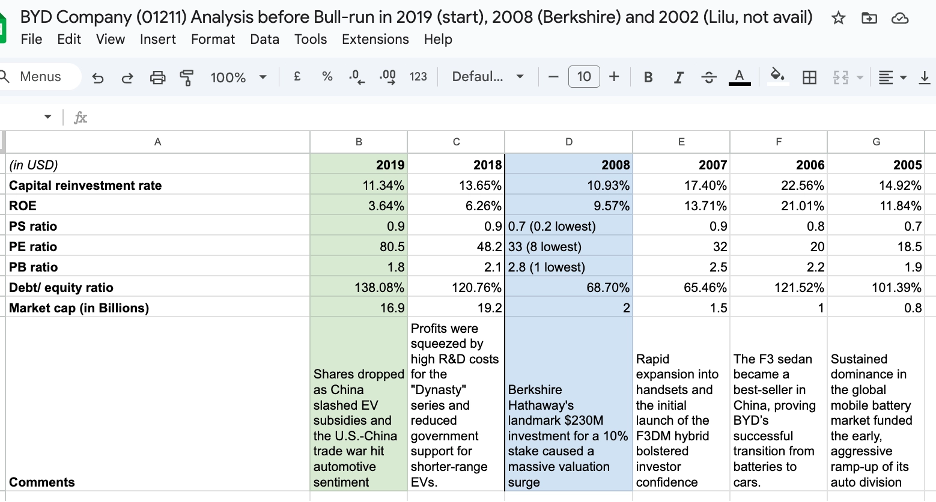
Apple Inc Income Statement
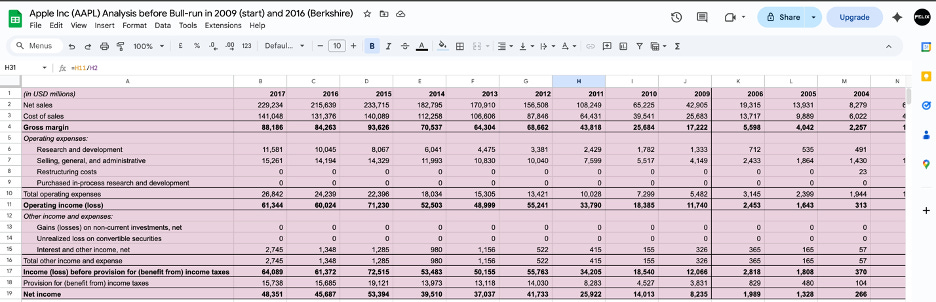
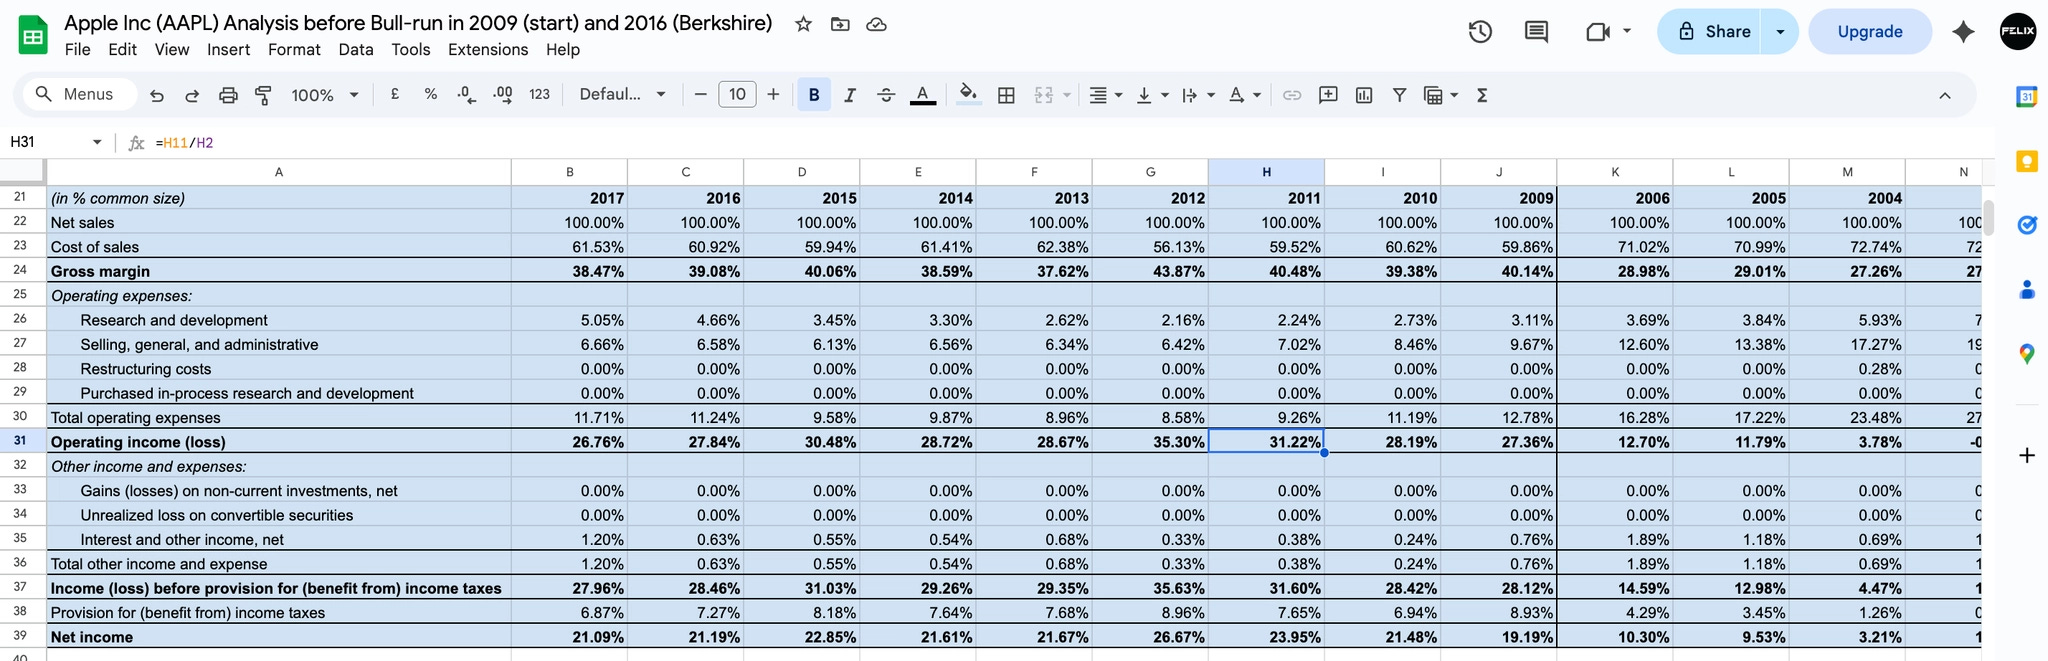
Alphabet Inc Income Statement
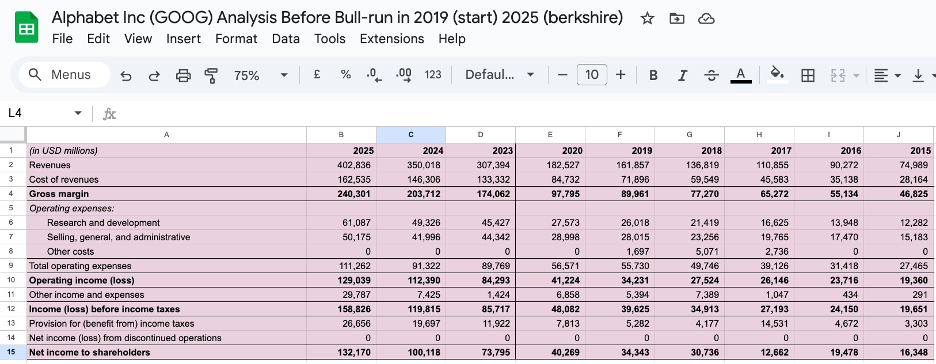
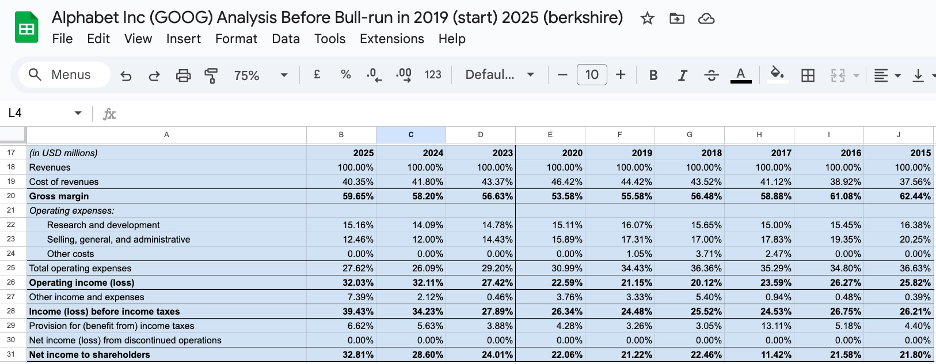
Amazon.com Inc Income Statement
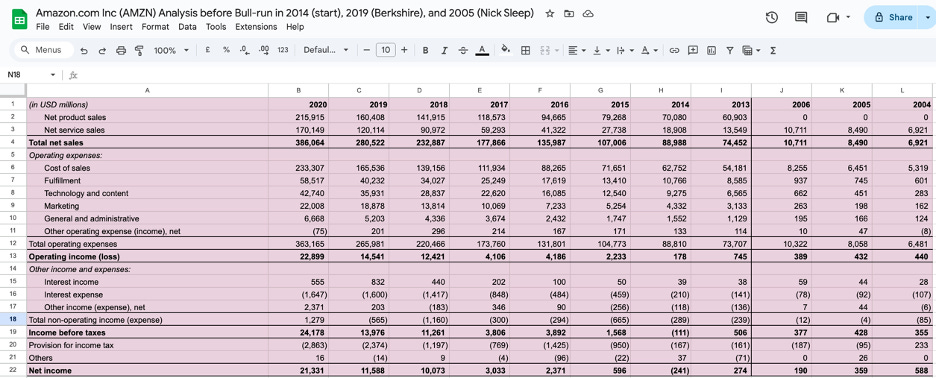
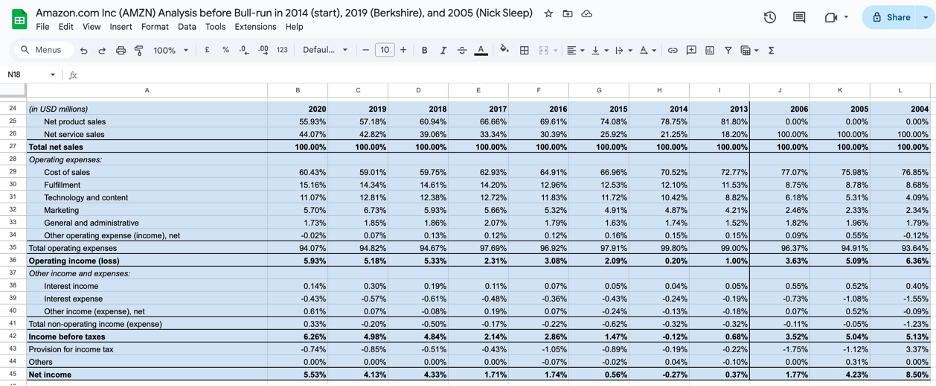
Coca-Cola Co Income Statement
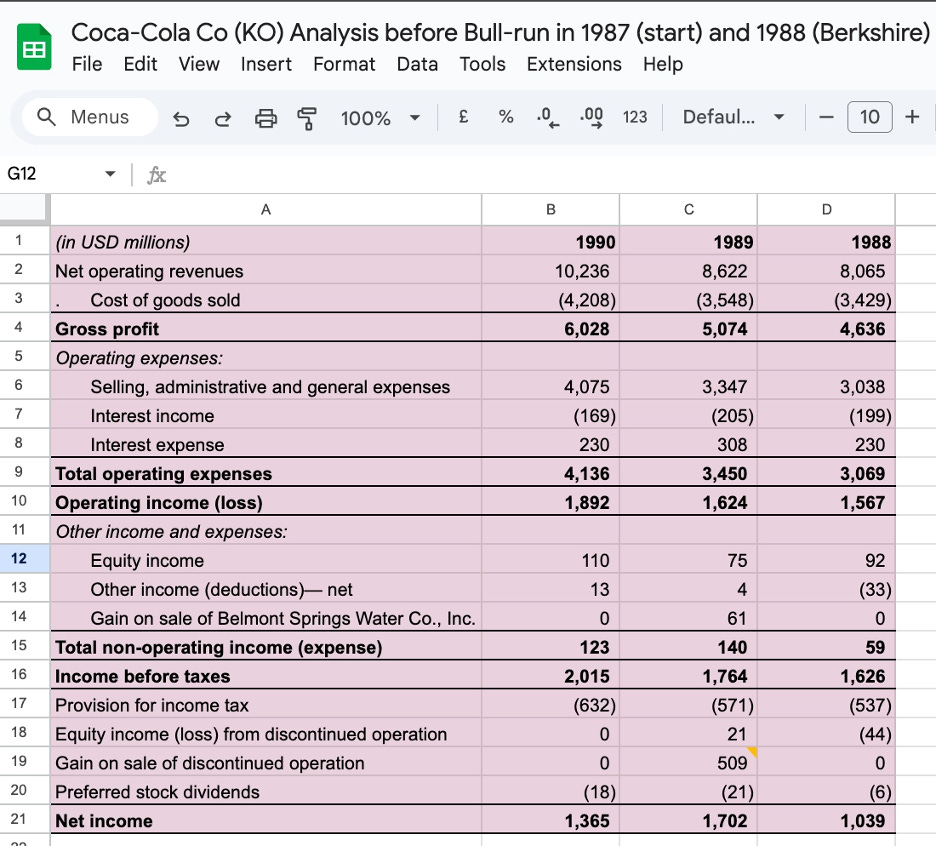
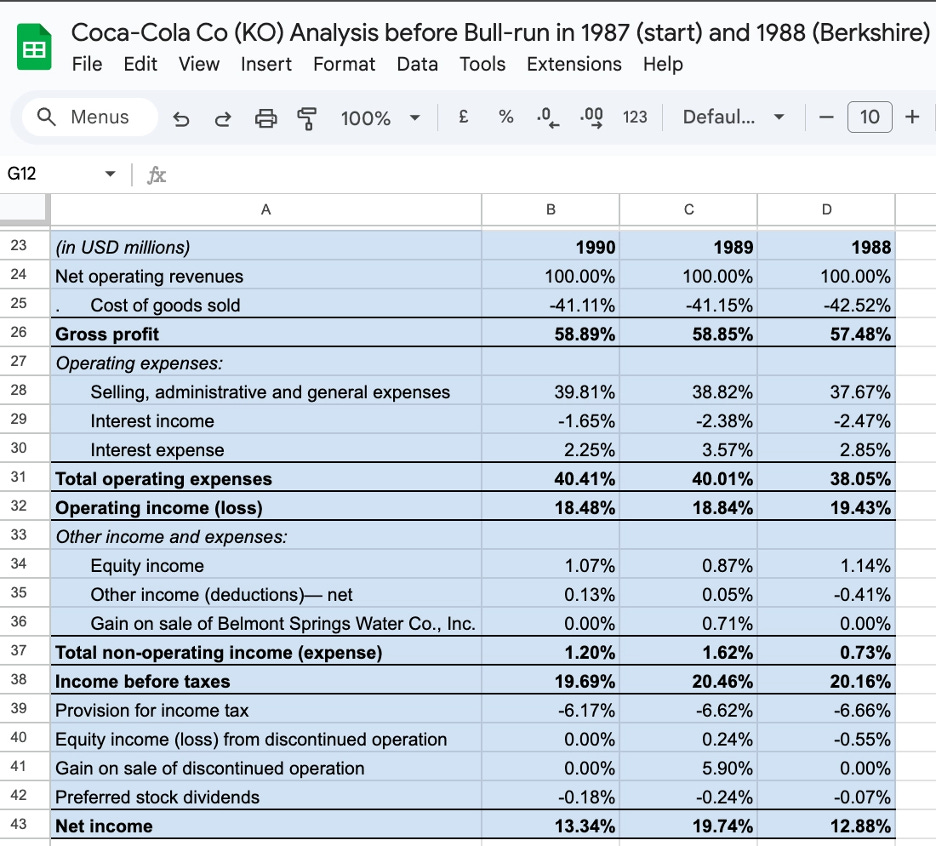
BYD Company Income Statement
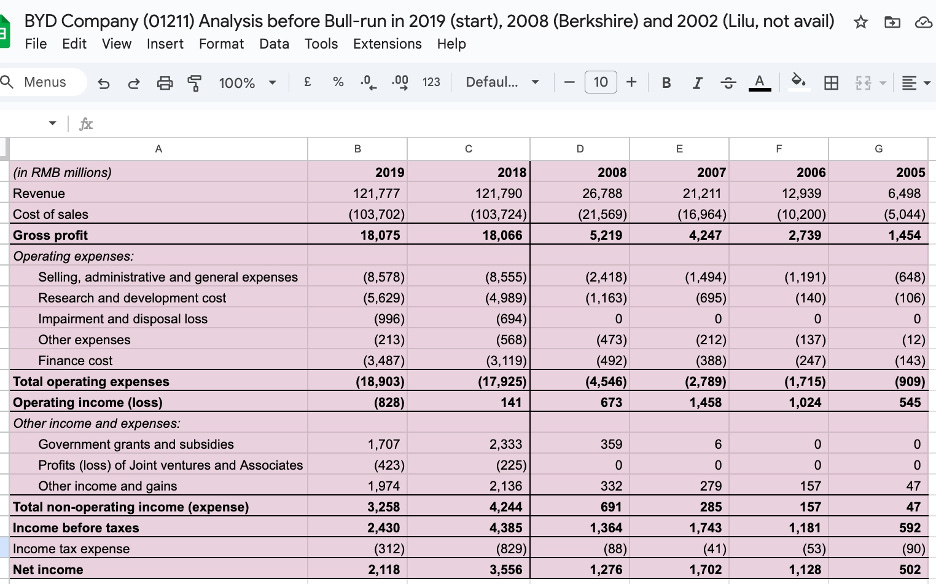
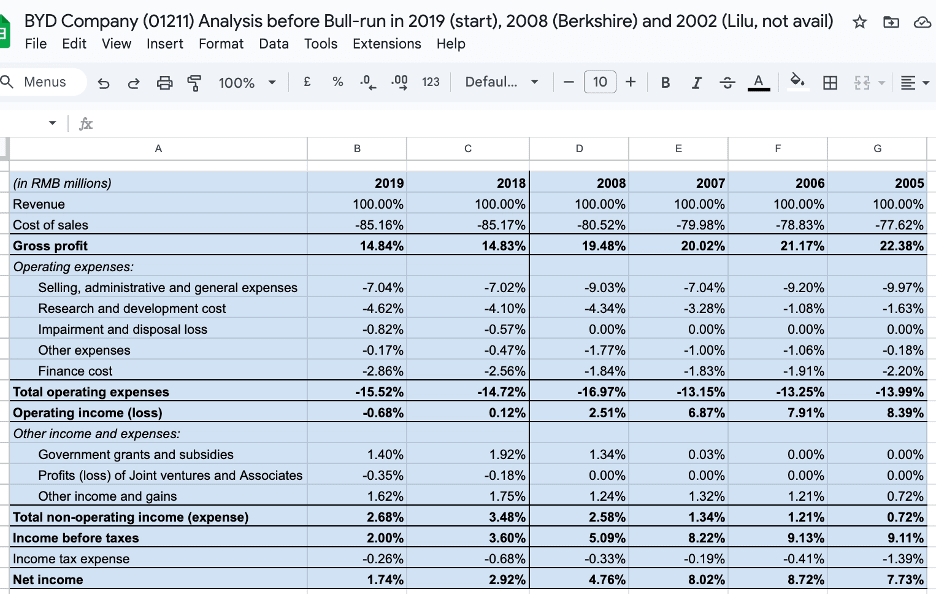
Apple Inc Balance Sheet
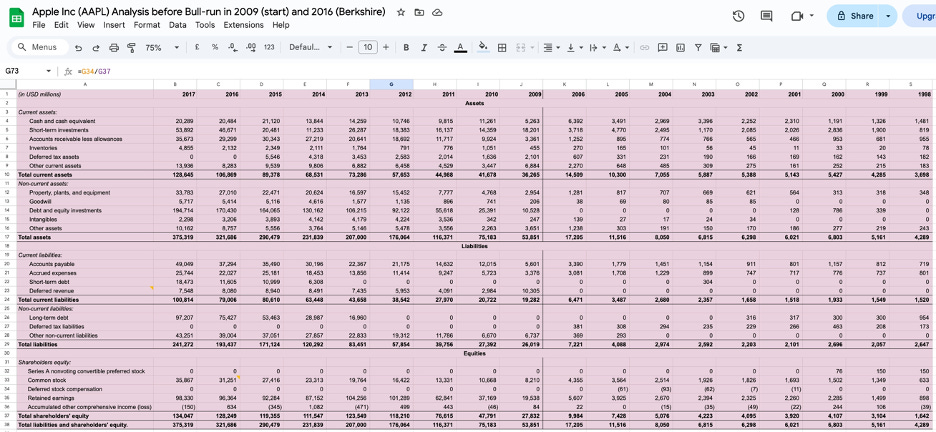
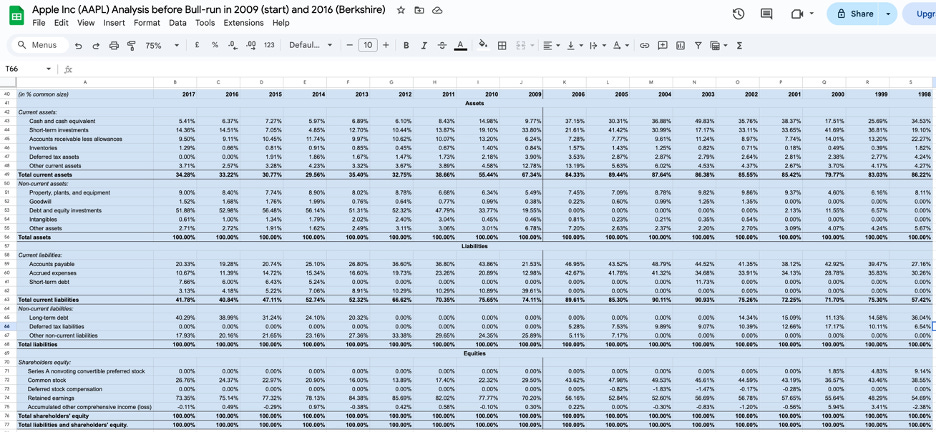
Alphabet Inc Balance Sheet
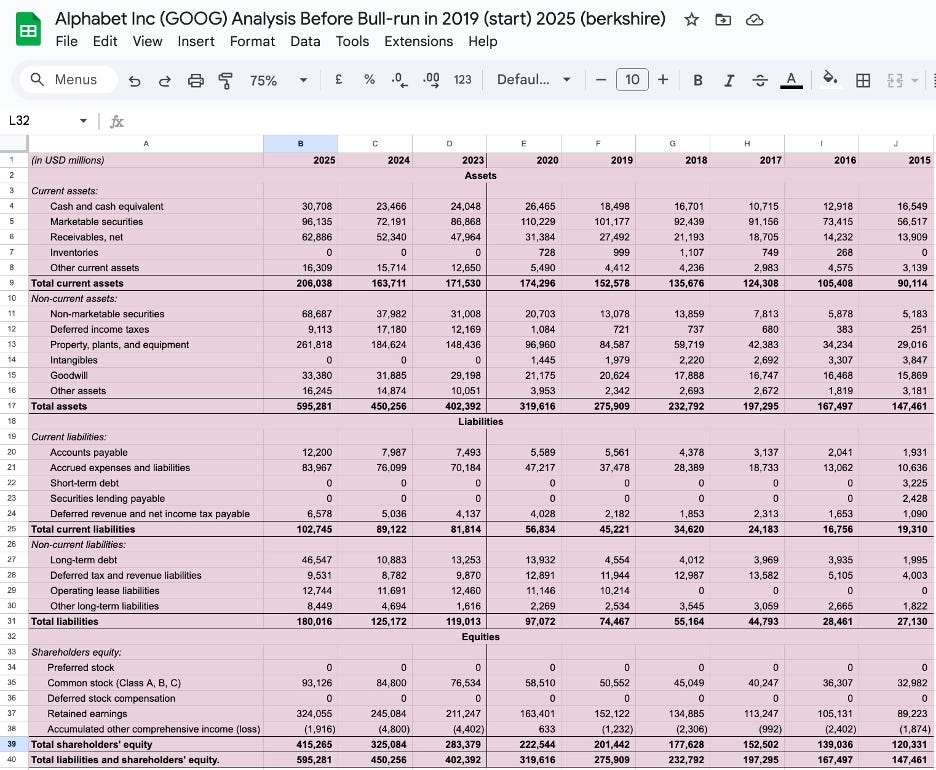
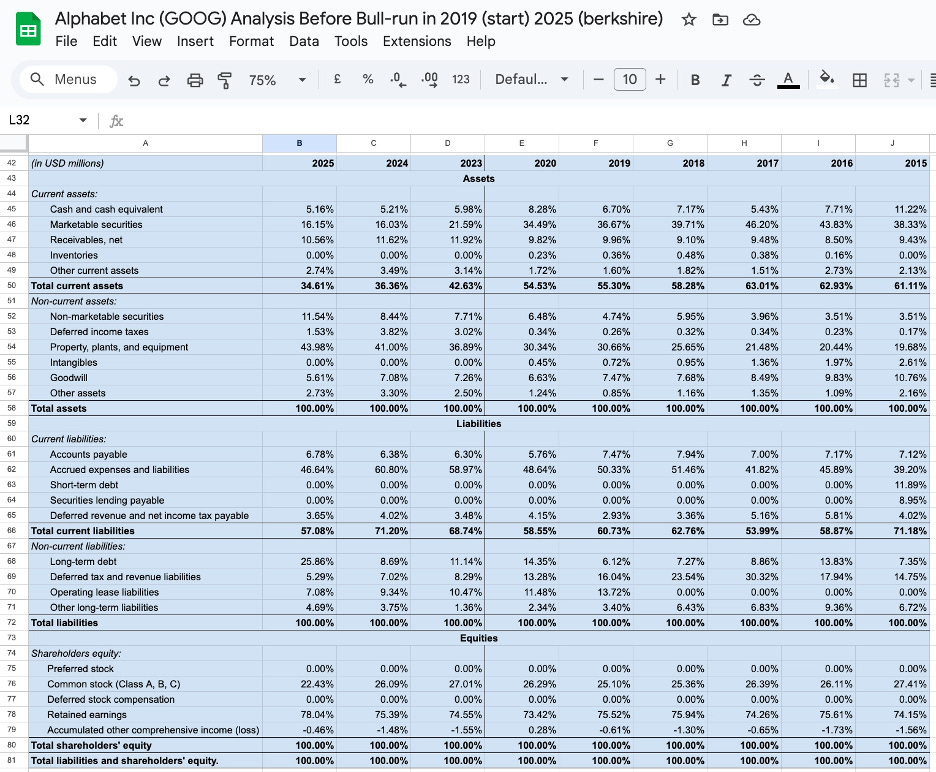
Amazon.com Inc Balance Sheet
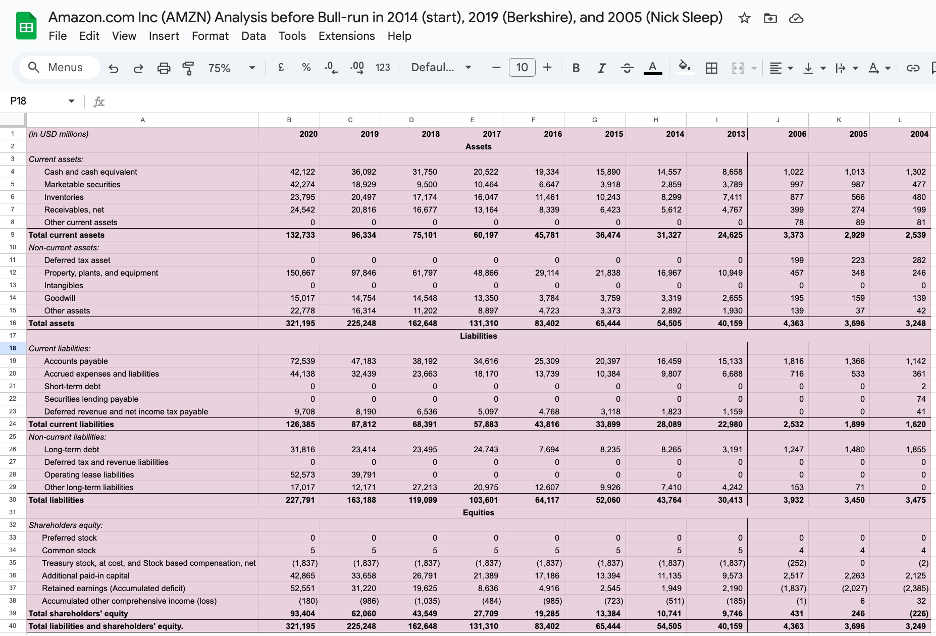
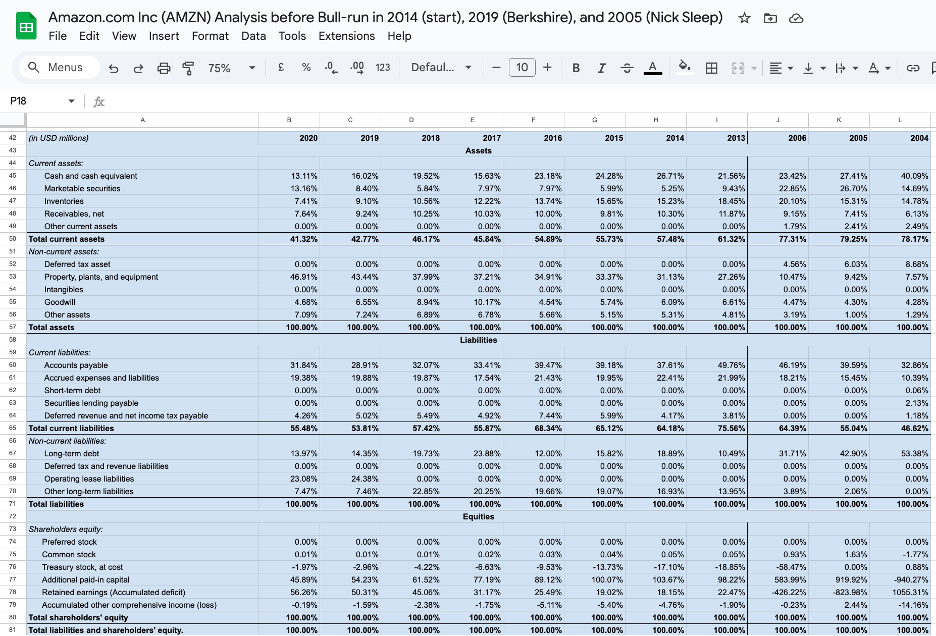
Coca-Cola Co Balance Sheet
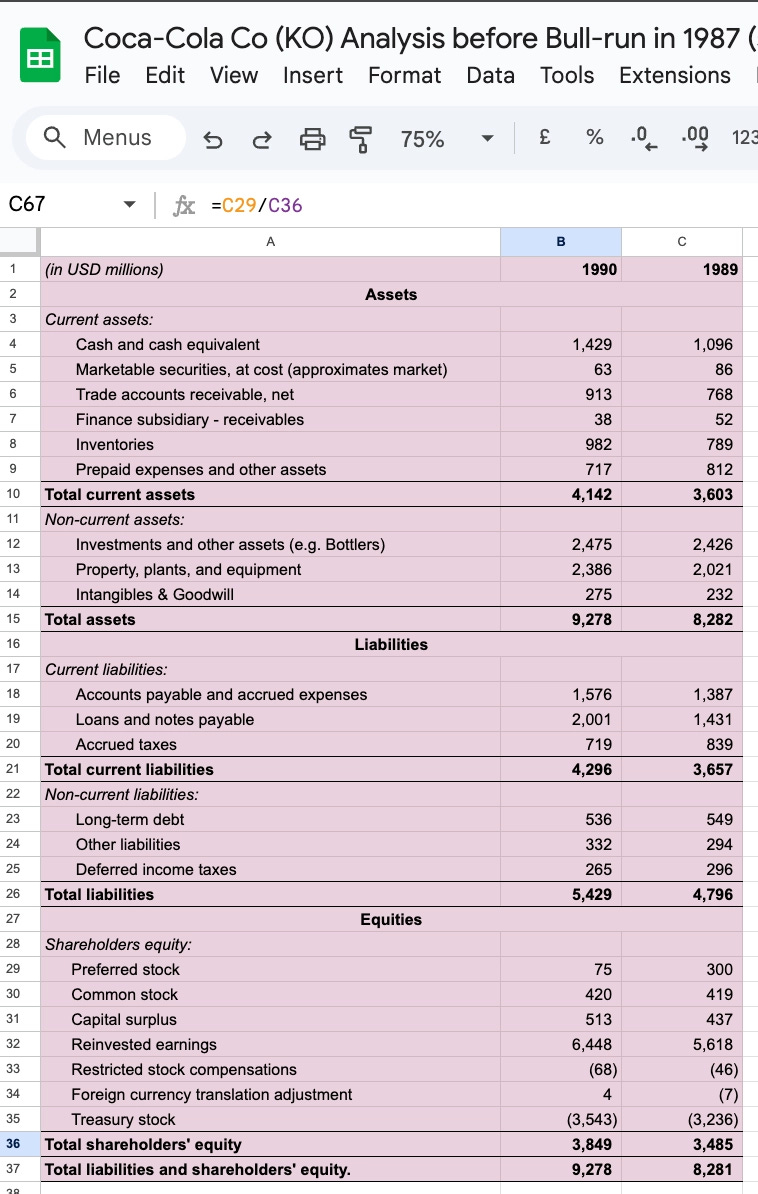
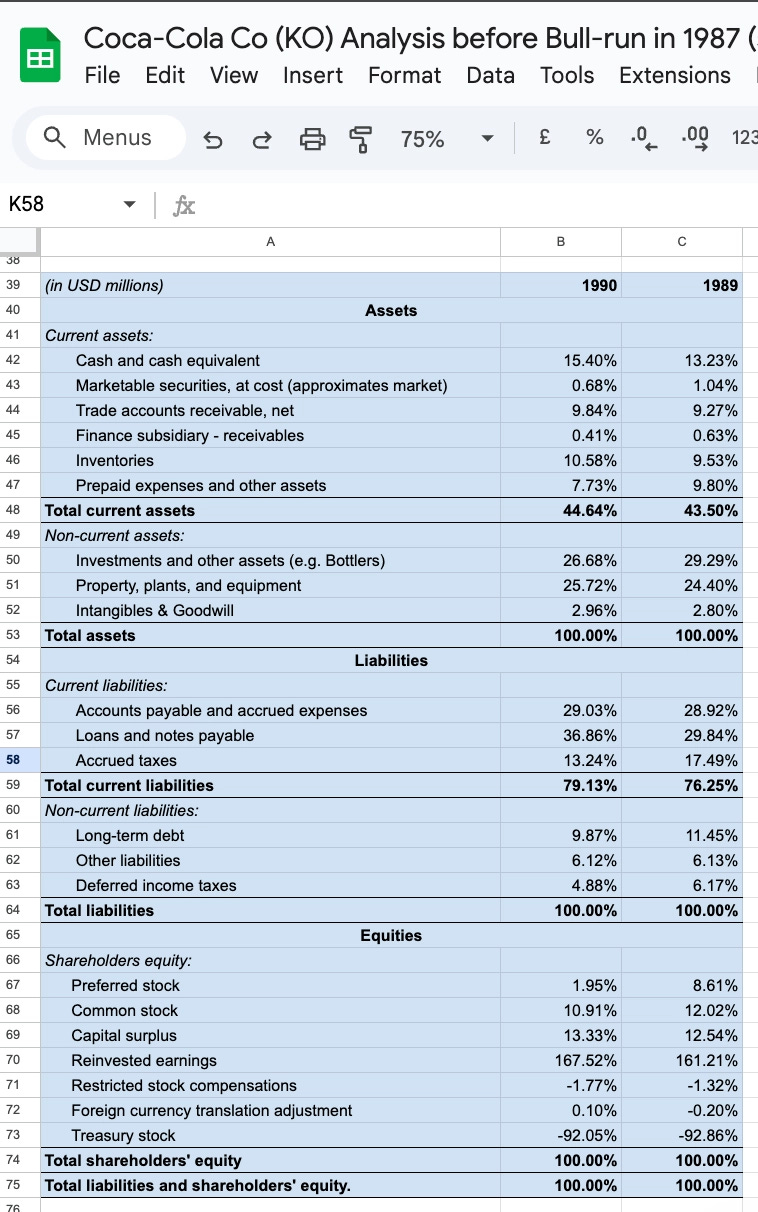
BYD Company Balance Sheet
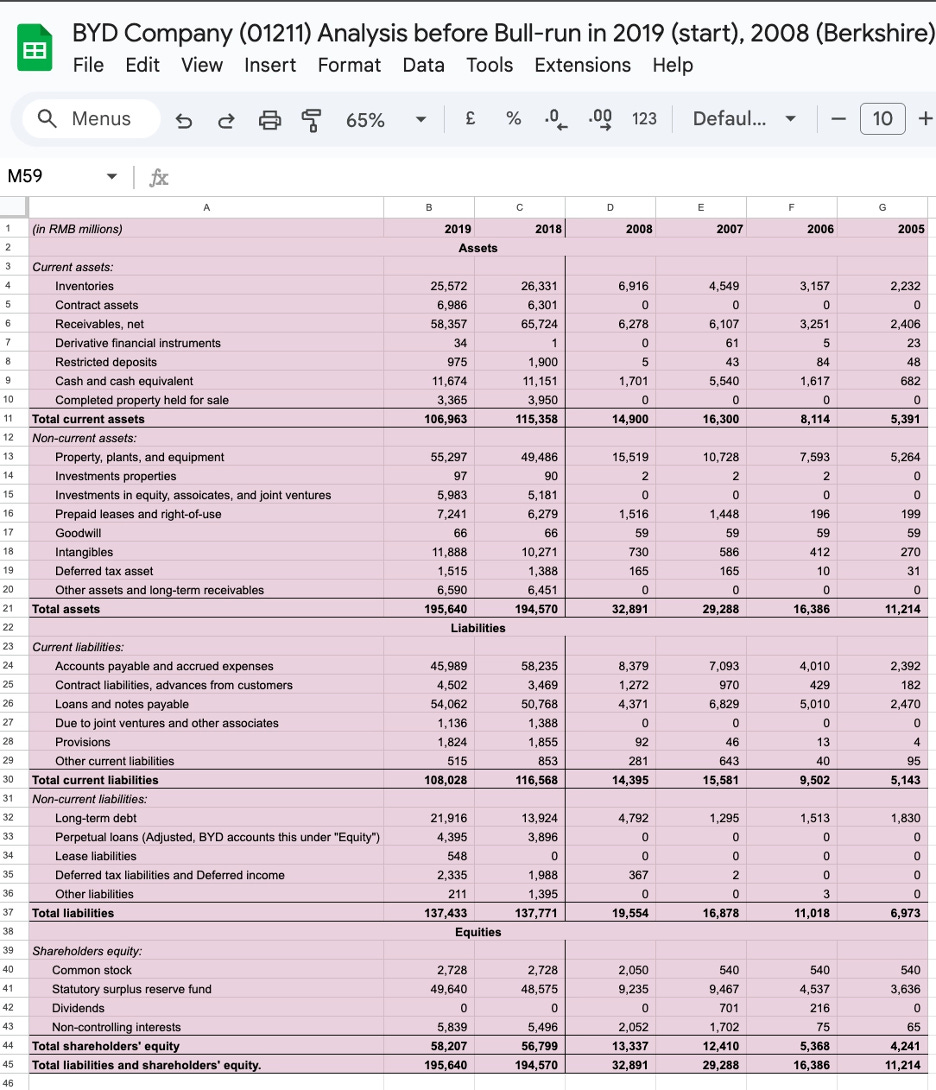
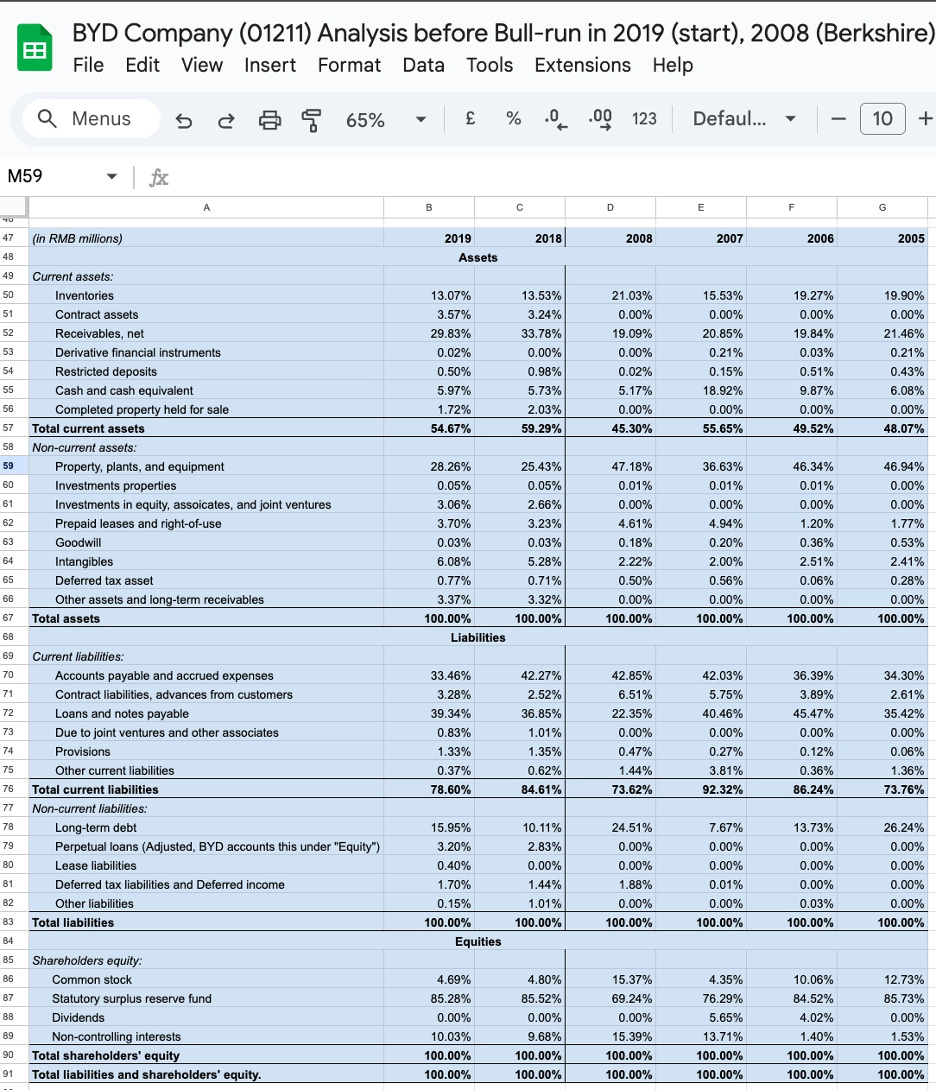
Apple Inc Cash Flow Statement
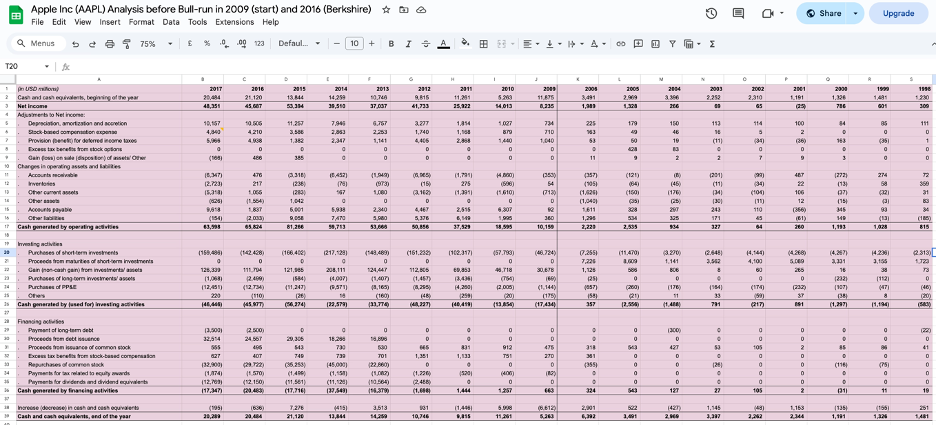
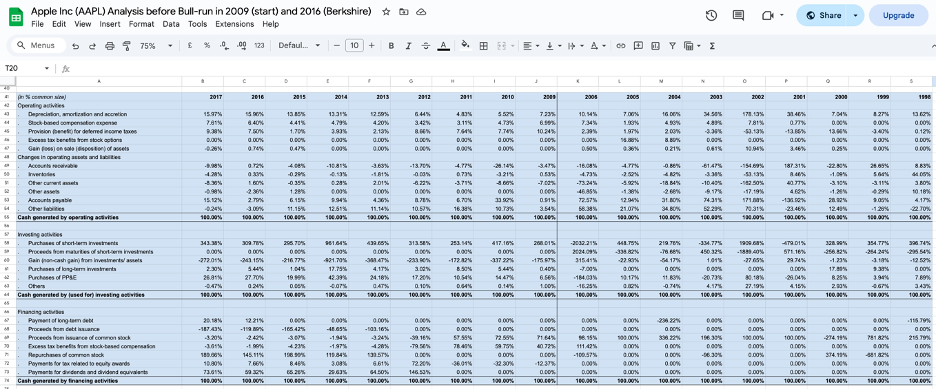
Alphabet Inc Cash Flow Statement
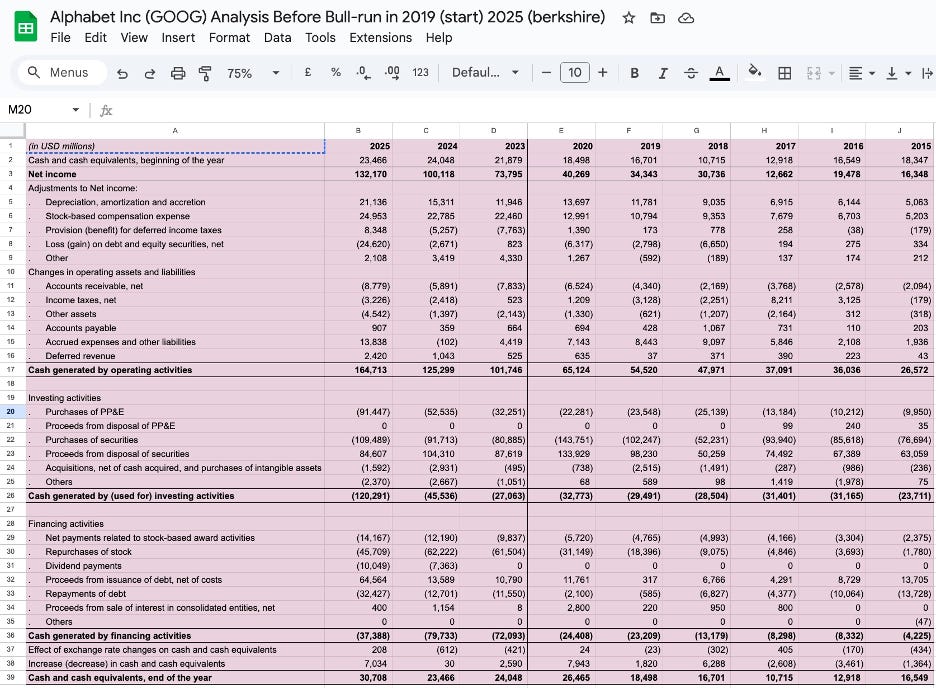
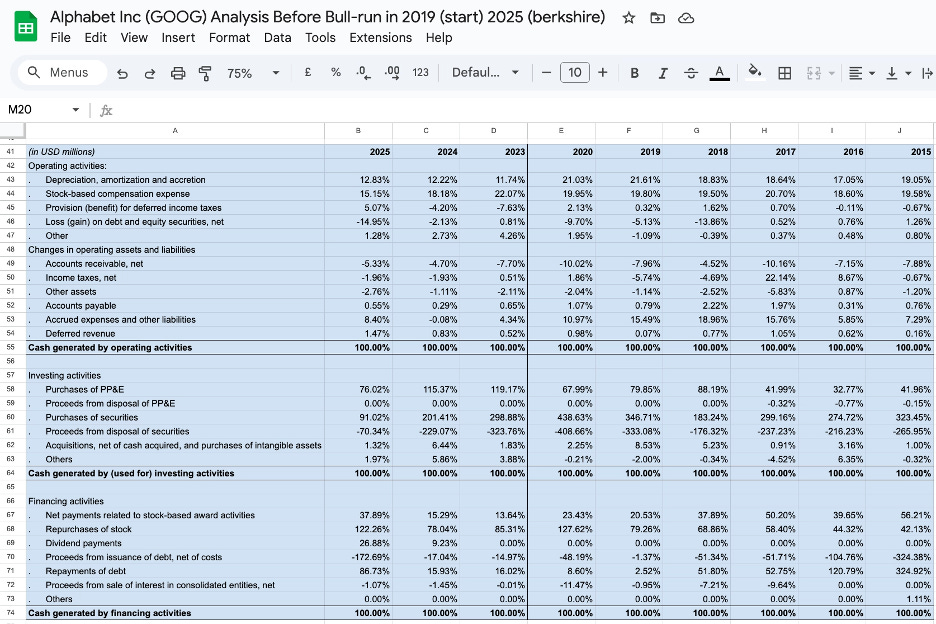
Amazon.com Inc Cash Flow Statement
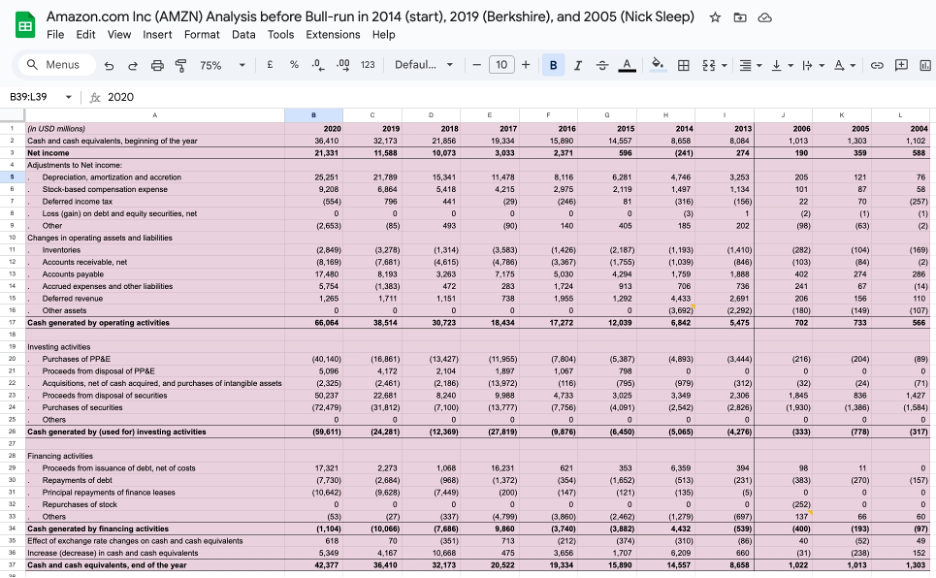
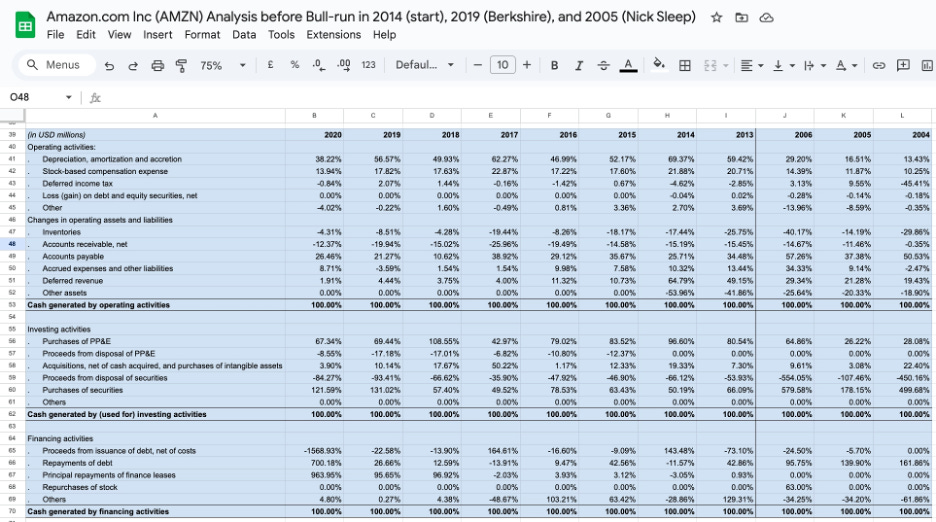
Coca-Cola Co Cash Flow Statement
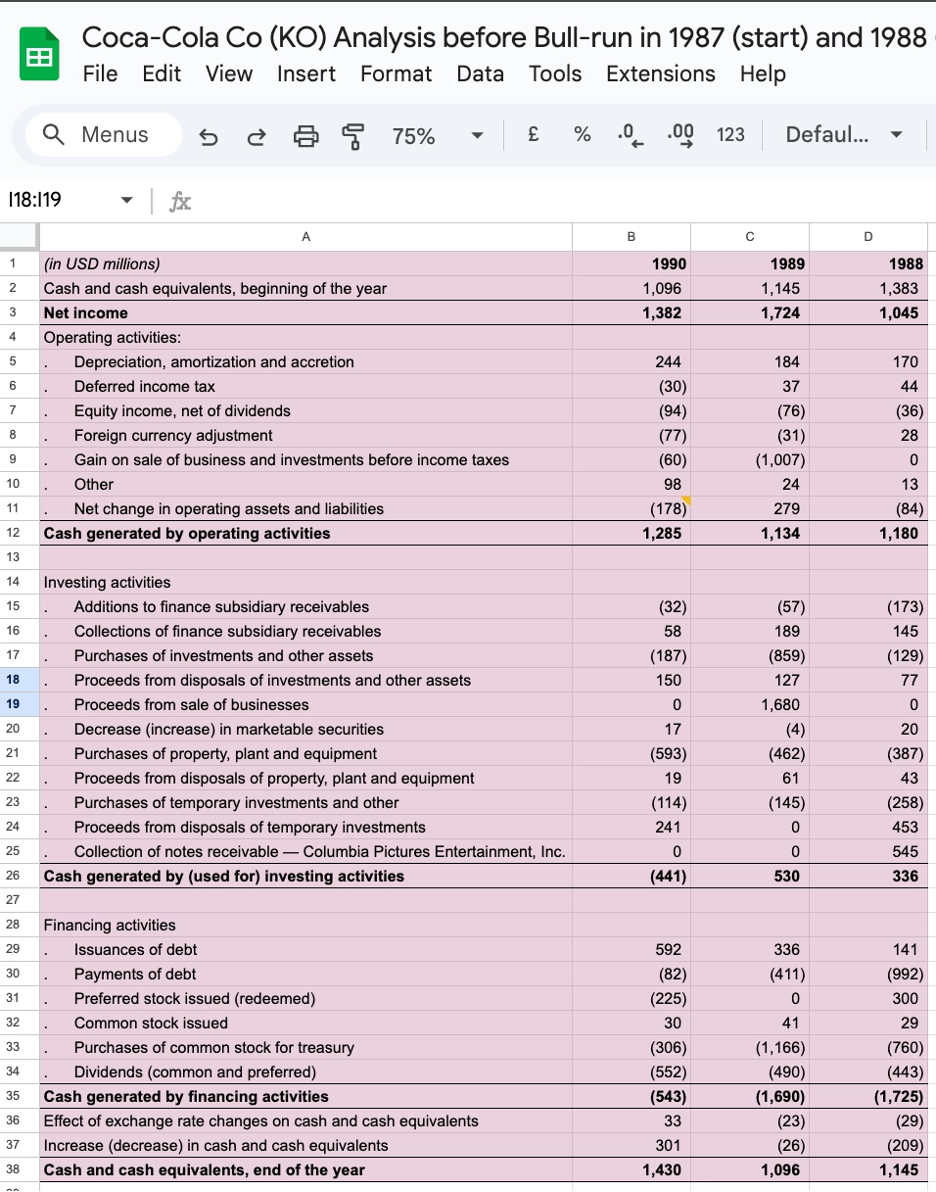
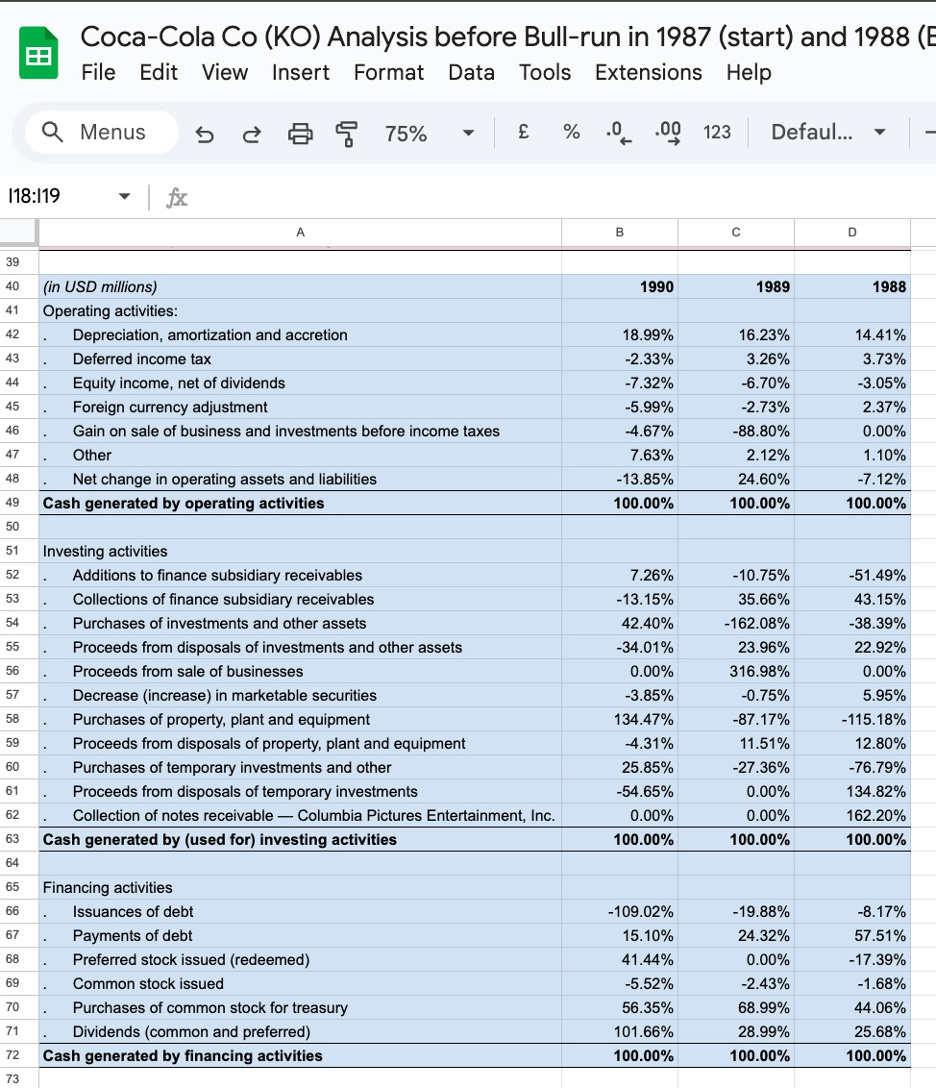
BYD Company Cash Flow Statement