
🛢️Basic Energy Primer Part 3 - Industry and Sector Technicals
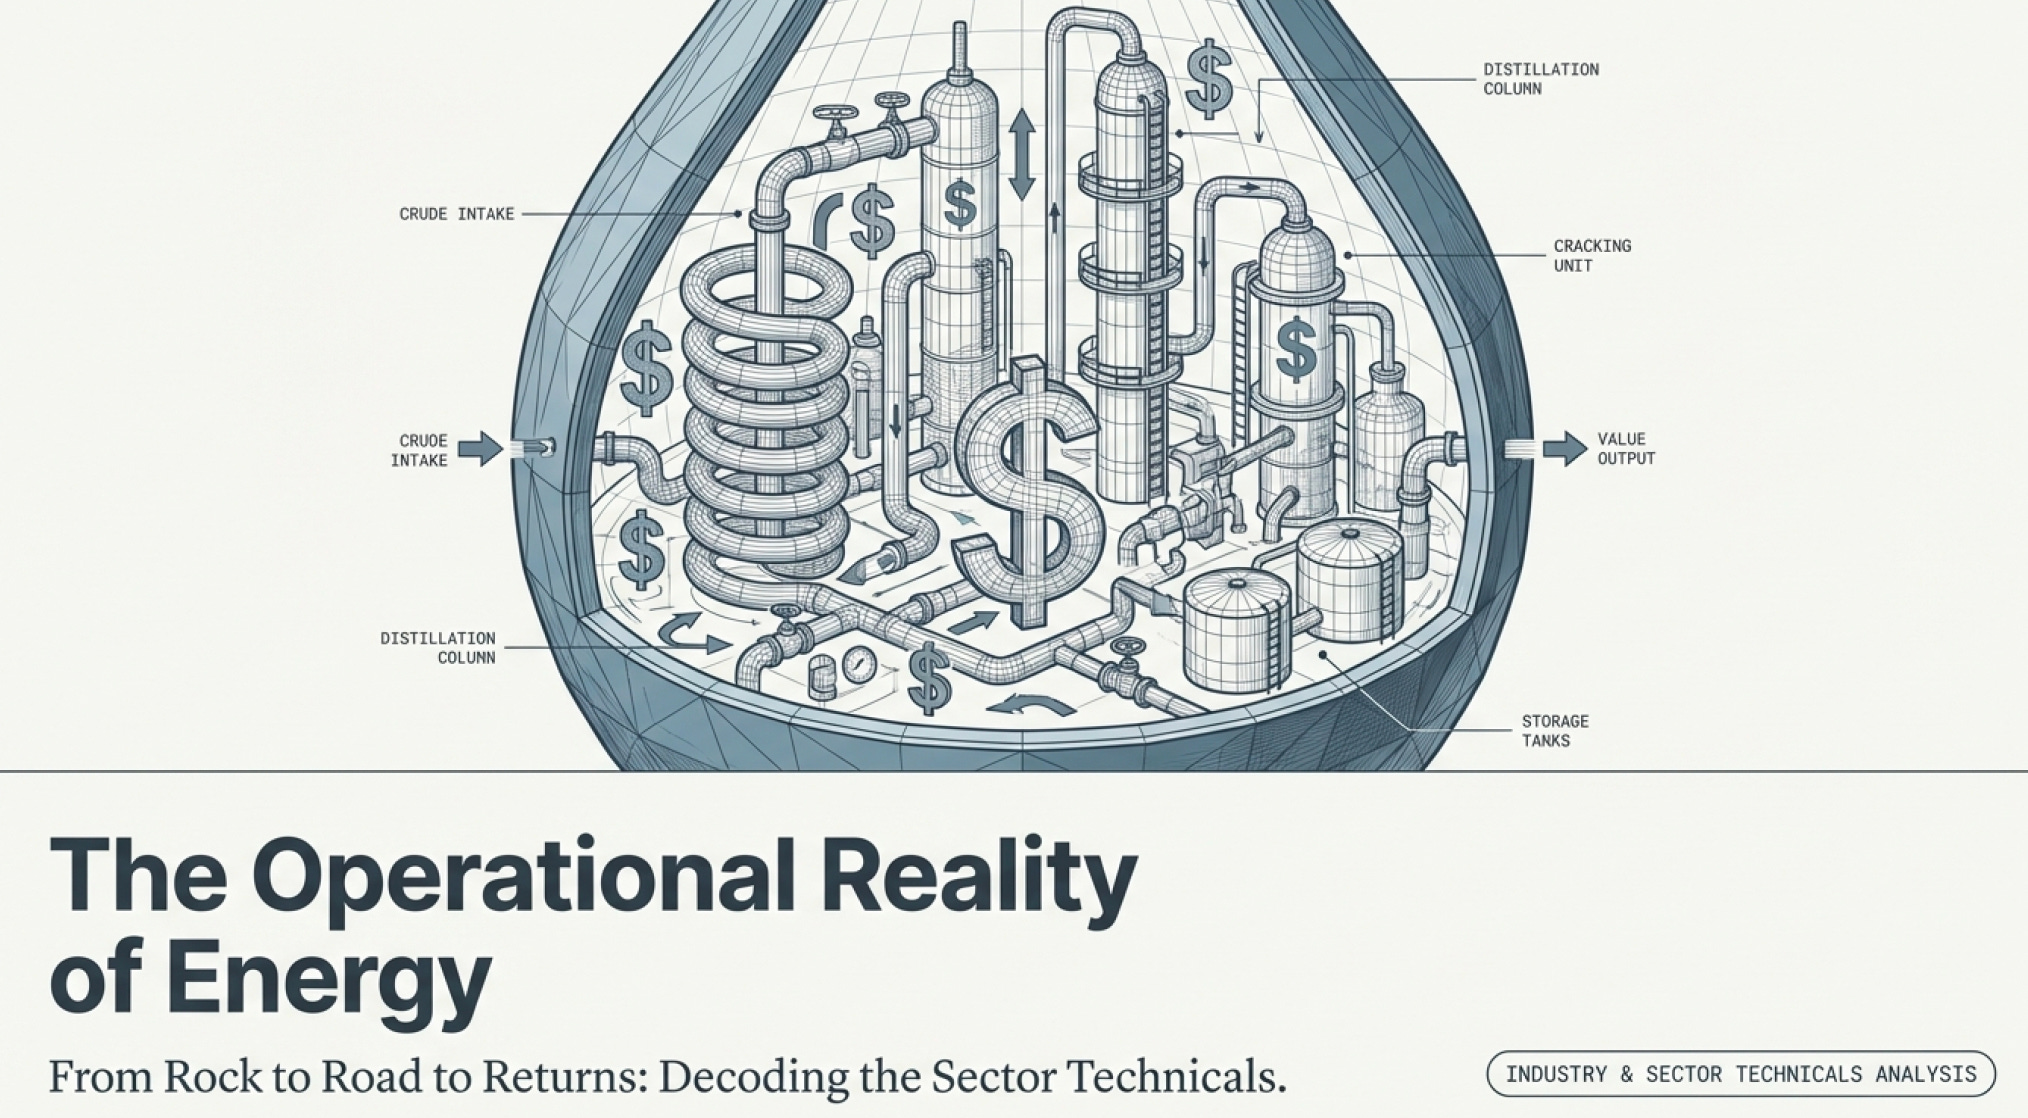
The Fossil Fuel Industry and Sector Technicals: Following the Molecule From Rock to Road

The Thursday That Changed Everything
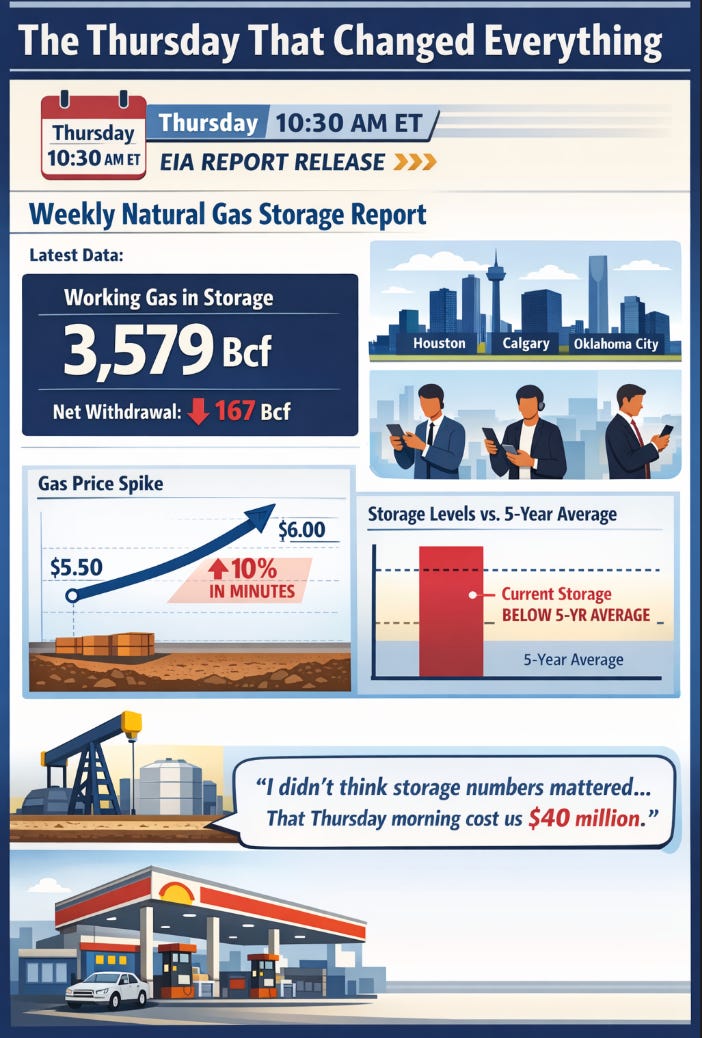
Every Thursday at 10:30 AM Eastern Time, something remarkable happens. Traders stop mid-conversation. Analysts pause their spreadsheets. Energy executives check their phones simultaneously across Houston, Calgary, and Oklahoma City.
They’re waiting for the Weekly Natural Gas Storage Report from the Energy Information Administration (EIA).
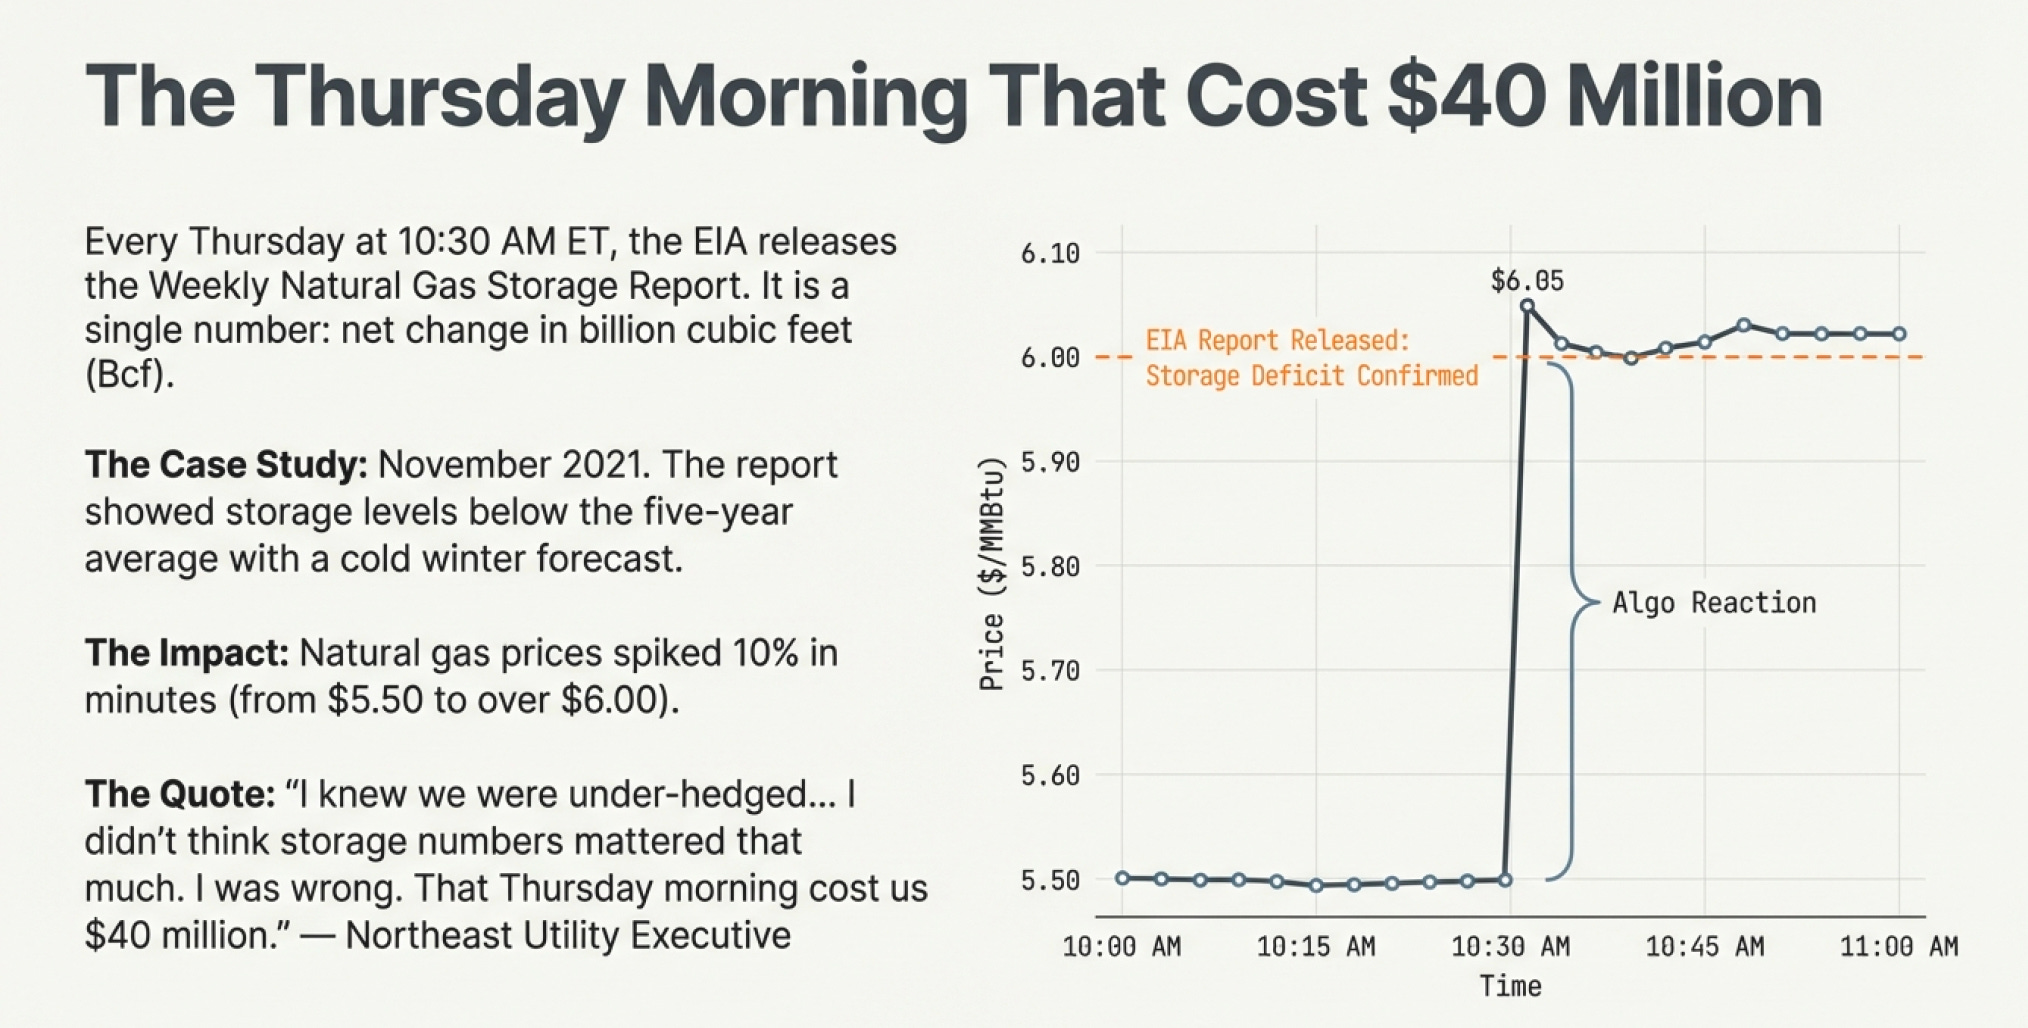
It’s a single number—how many billion cubic feet of natural gas went into or out of storage that week. That’s it. No drama. No narrative. Just: “Working gas in storage totaled 3,579 Bcf, representing a net decrease of 167 Bcf from the previous week.”
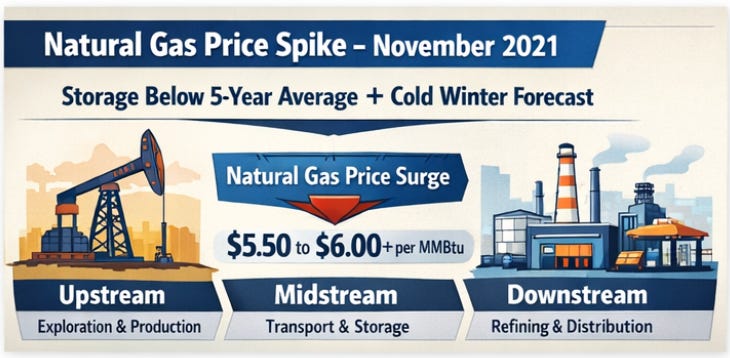
And yet, in November 2021, that single number caused natural gas prices to spike 10% in minutes.
Here’s what happened: The report showed storage levels heading into winter were significantly below the five-year average. Weather forecasts predicted a cold winter. Suddenly, every trader realized the same thing simultaneously—if winter was colder than average, the U.S. might not have enough natural gas in storage to meet demand.
Natural gas jumped from $5.50 per MMBtu to over $6.00. Companies with large storage positions made millions that morning. Companies that had sold forward contracts (expecting prices to drop so you sell now in a bet that you can buy at lows later) without securing gas supply scrambled to cover their positions at higher prices.
One executive at a utility in the Northeast later confessed: “I knew we were under-hedged. But I kept waiting for prices to come down. I didn’t think storage numbers mattered that much. I was wrong. That Thursday morning cost us $40 million.”
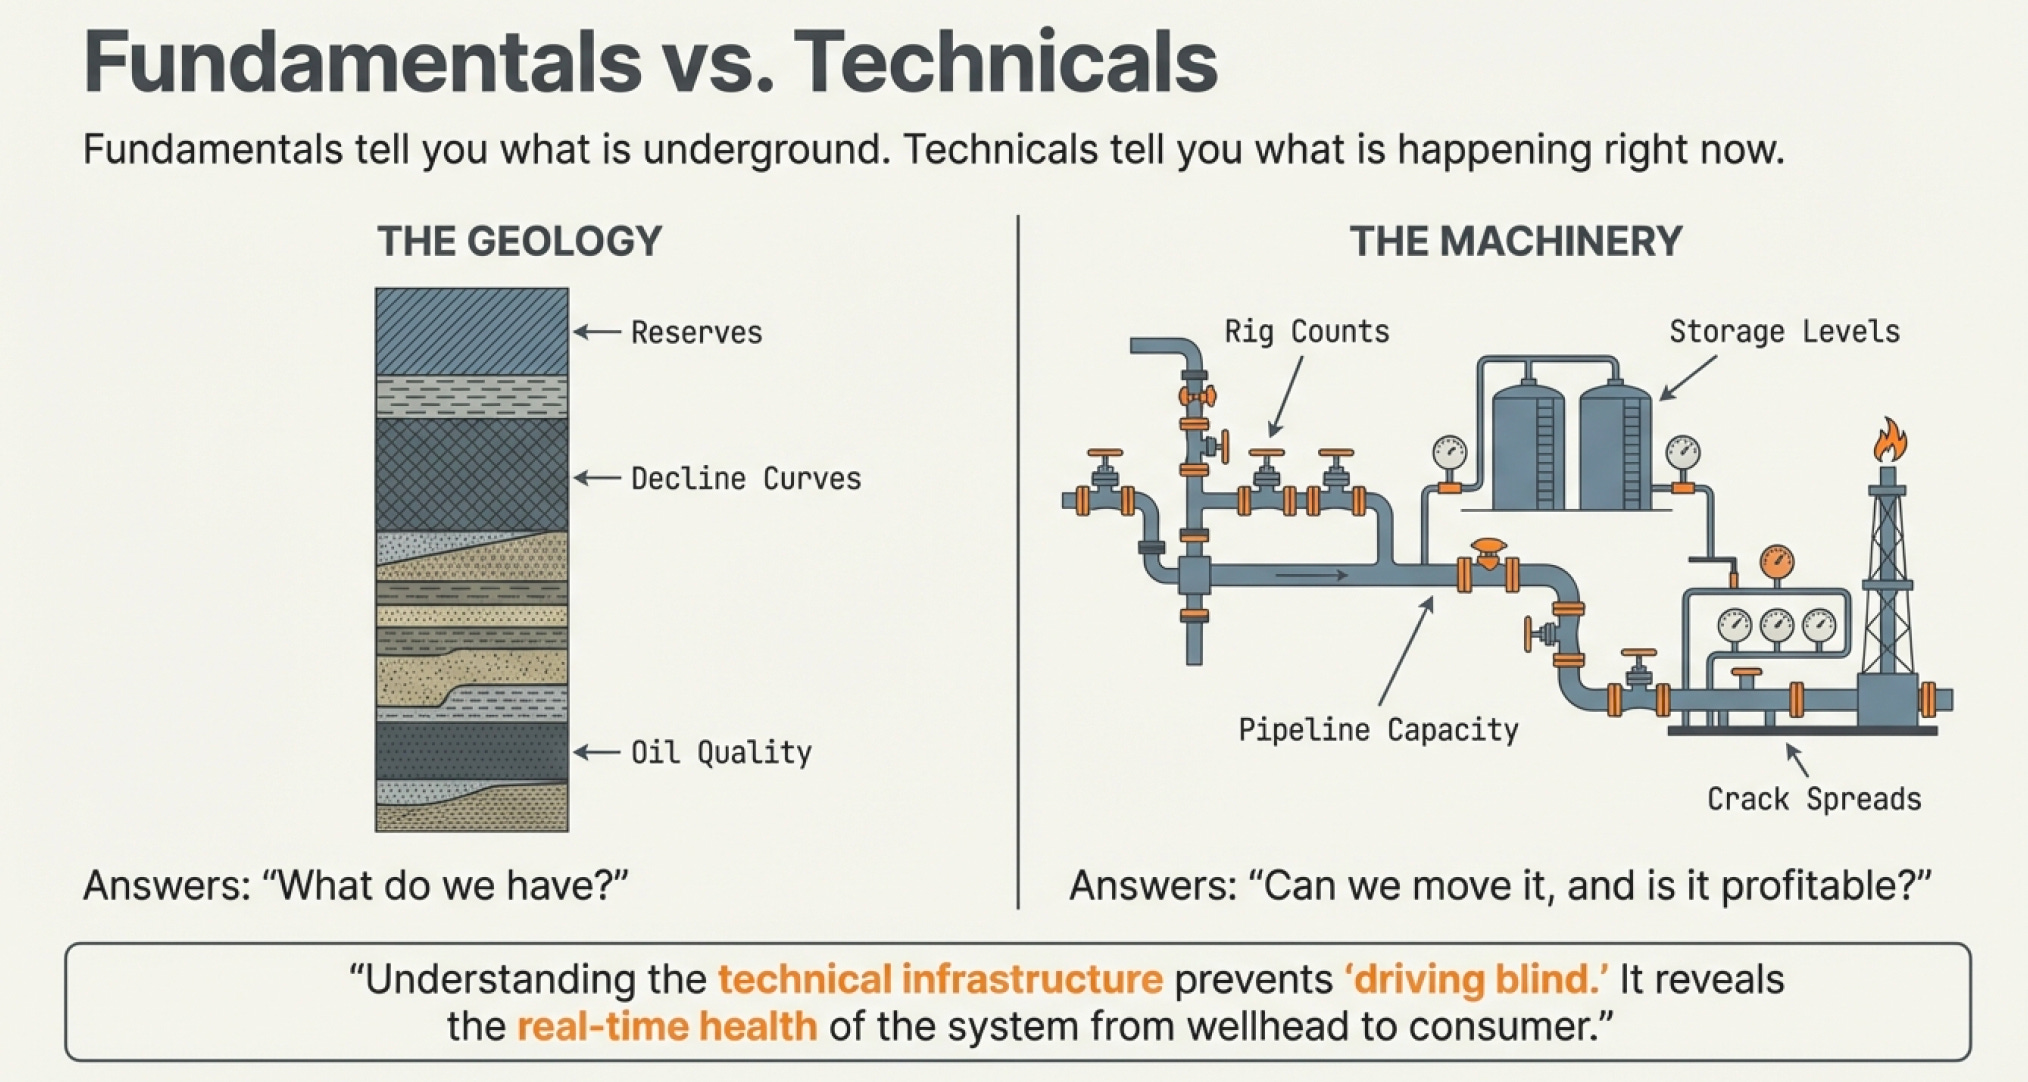
This is what happens when you don’t understand the technical infrastructure of the industry. The fundamentals—reserves, decline curves, oil quality—tell you what’s underground. The competitive landscape shows you who’s positioned to win.
But the sector technicals? They tell you what’s actually happening right now, in real-time, across the entire system from wellhead to consumer.
And if you don’t understand how to read these signals, you’re driving blind.
How a Molecule Moves From Mile Underground to Your Gas Tank
The fossil fuel industry isn’t one business. It’s three businesses stacked on top of each other, like Lego blocks that must fit together perfectly or the whole structure collapses.
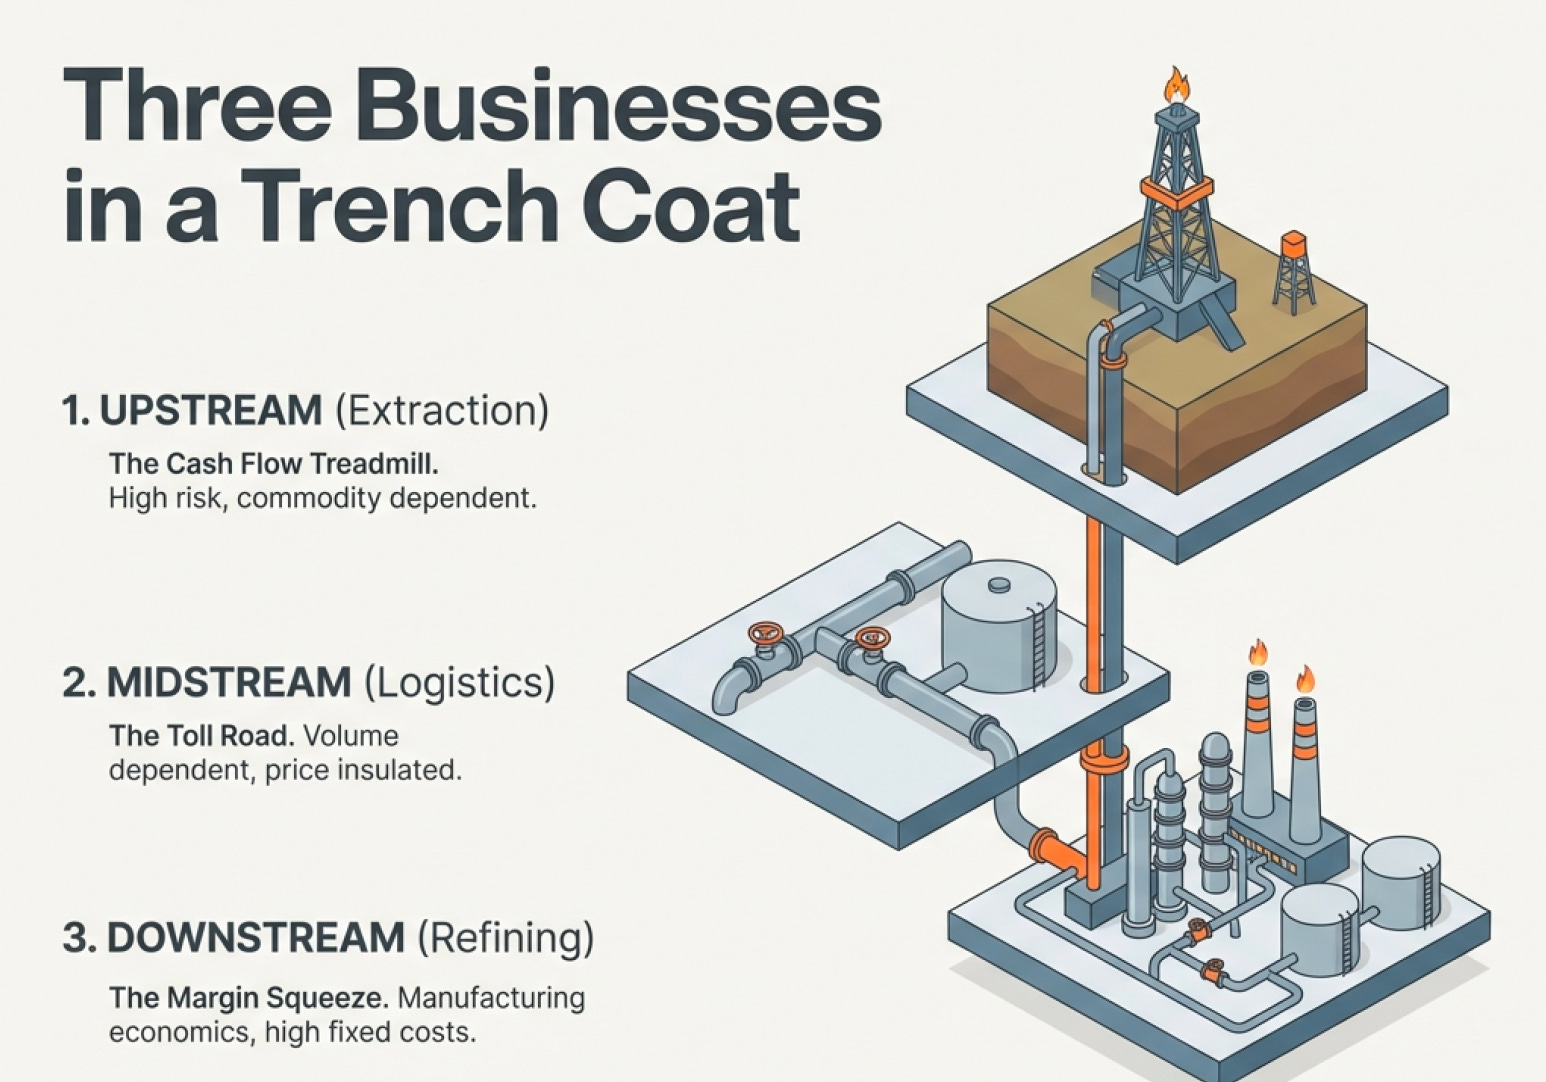
Upstream: Finding and extracting oil and gas from underground
Midstream: Moving, storing, and processing it
Downstream: Turning it into products people actually use
This sounds simple. It’s not. The complexity lies in how these three segments interact, and how value—and risk—gets distributed across them.
Let’s follow a single oil molecule and see what really happens.
The Upstream Drama - Where Value Is Created... Or Destroyed
Our oil molecule starts its journey two miles underground in the Permian Basin of West Texas, trapped in tiny pores within rock that formed 250 million years ago.
An upstream company—let’s say Pioneer Natural Resources (now part of ExxonMobil after their 2024 merger)—spent years acquiring leases on the land above this rock. They studied seismic data showing where oil might be concentrated. They drilled a well, spending about $7-10 million. They fracked the well, pumping millions of gallons of water and sand underground to create fractures in the rock, allowing oil to flow.
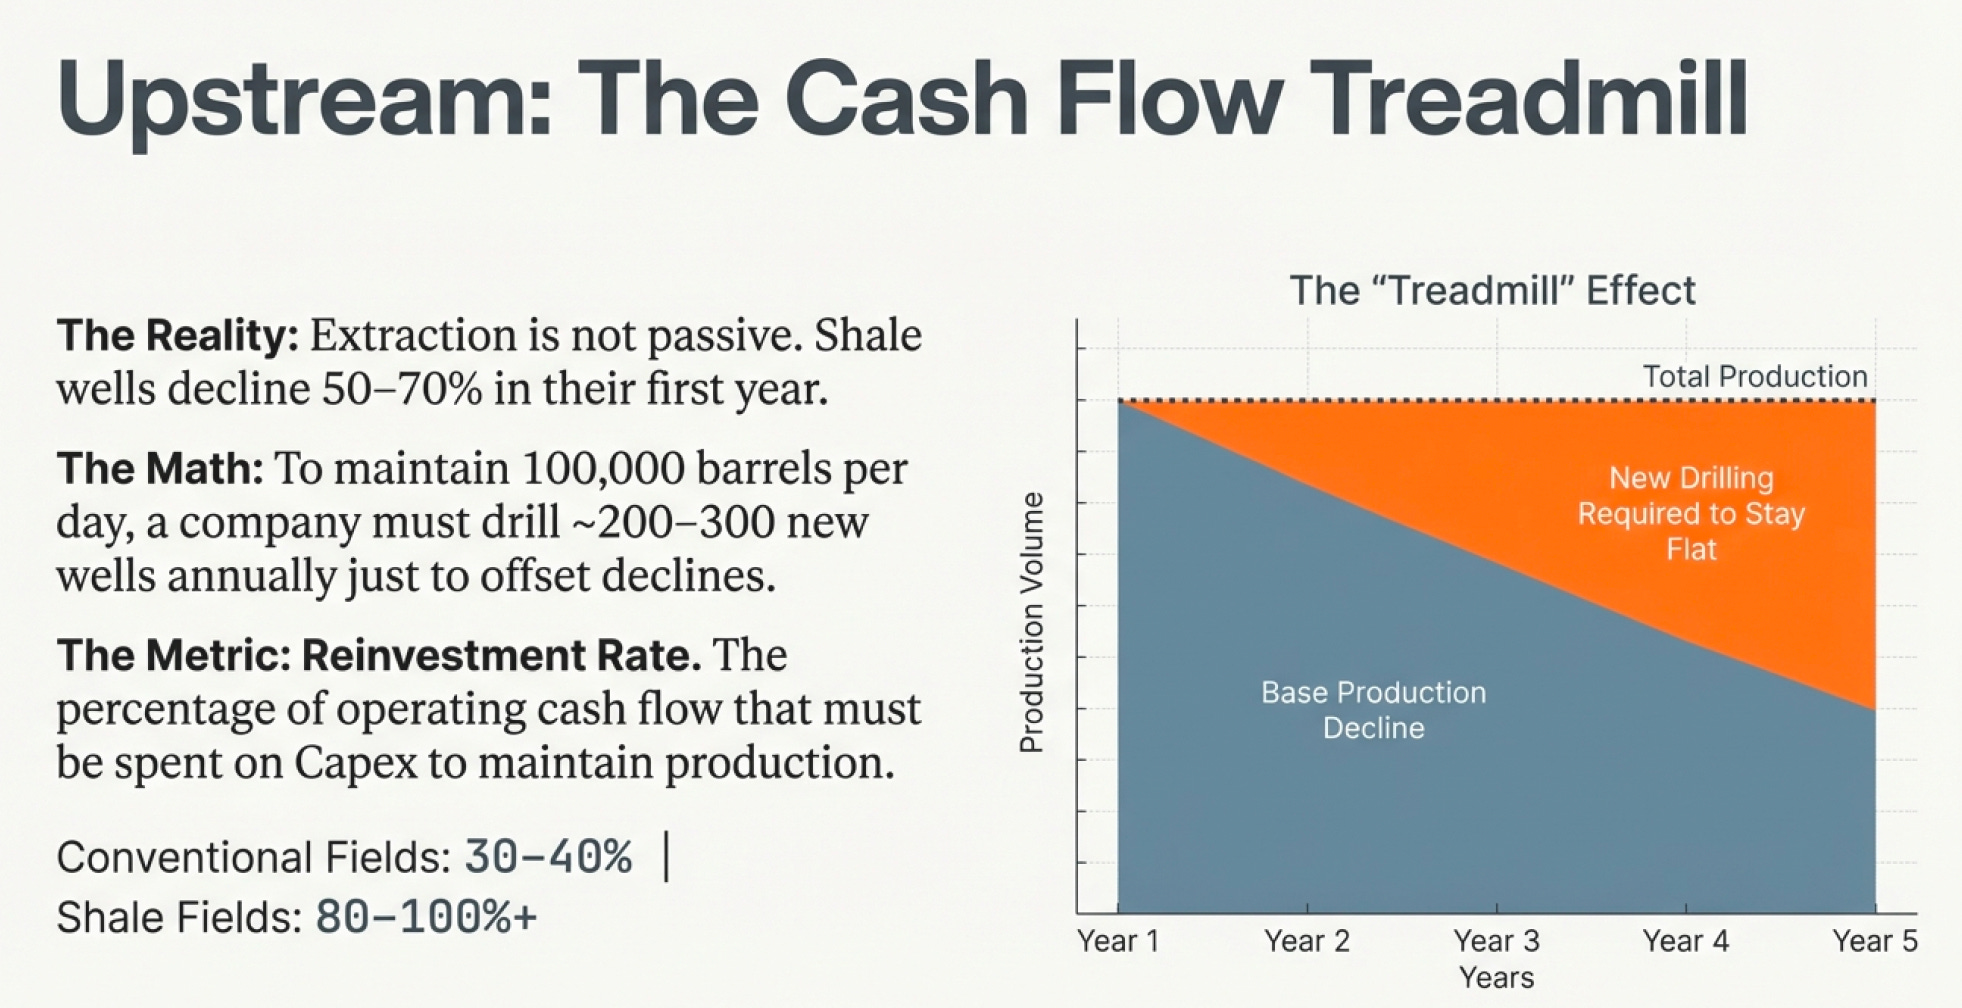
Now the well is producing 1,200 barrels per day. But here’s what most people miss: This isn’t a passive process. Upstream operations require constant capital investment just to maintain production.
Remember shale well decline curves? First-year decline is 50-70%. To keep producing 100,000 barrels per day as a company, Pioneer must drill roughly 200-300 new wells per year just to offset declines from existing wells.
This is why cash flow analysis is crucial for upstream companies.
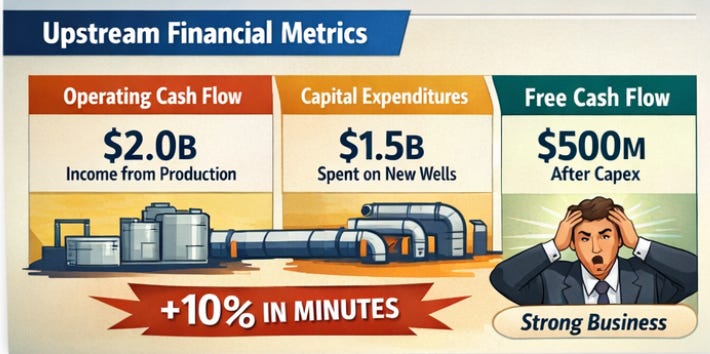
Look at any upstream company’s financials, and you’ll see three critical numbers:
Operating Cash Flow: Cash generated from producing oil and gas
Capital Expenditures (Capex): Cash spent drilling new wells
Free Cash Flow: Operating cash flow minus Capex
The relationship between these numbers tells you everything about the business quality.
Scenario A: A company generates $2 billion in operating cash flow and spends $1.5 billion on Capex. Free cash flow is $500 million. They can pay dividends, buy back stock, or reduce debt. Good business.
Scenario B: A company generates $2 billion in operating cash flow but must spend $2.5 billion on Capex just to maintain production. Free cash flow is negative $500 million. They must raise more capital or cut production. Terrible business, even though their oil production looks identical to Scenario A.
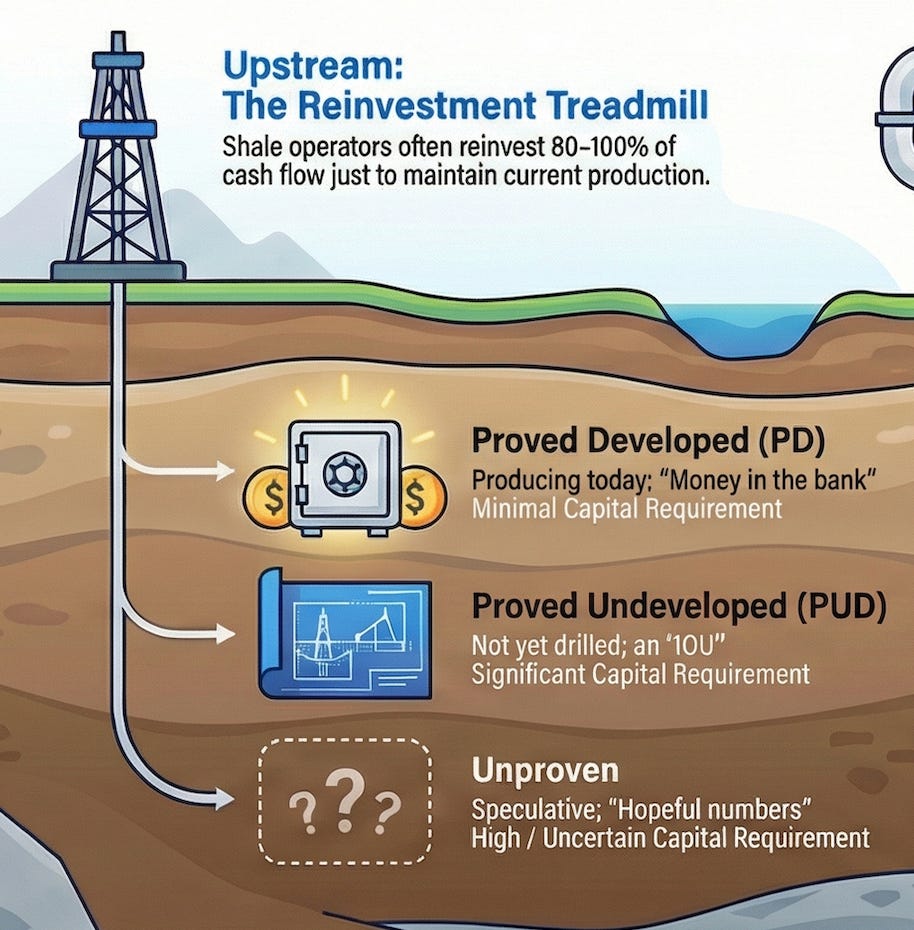
This is why the Reinvestment Rate matters so much. It’s the percentage of cash flow that must be reinvested just to maintain current production. For conventional fields, this might be 30-40%. For shale, it can be 80-100% or more.
ConocoPhillips, which ranked as the top global oil and gas company for technological readiness in 2025, has managed to achieve a reinvestment rate below 50% by high-grading their portfolio—keeping only the most capital-efficient assets. They drill fewer wells but get more oil per dollar spent.
Meanwhile, many smaller shale operators are on a treadmill, spending every dollar they generate just to keep production flat.
This is why understanding the difference between production growth and cash flow growth is critical. A company can grow production 20% while destroying shareholder value if they’re spending more capital than the new production will ever generate in cash flow.
The Upstream Asset Inventory - What Actually Sits on the Balance Sheet
Upstream companies don’t just own oil in the ground. They own a complex web of assets that determine whether they can actually get that oil out:
Leases: The right to drill on specific land, typically expiring after 3-5 years unless production begins. Companies must continuously renew these or lose access.
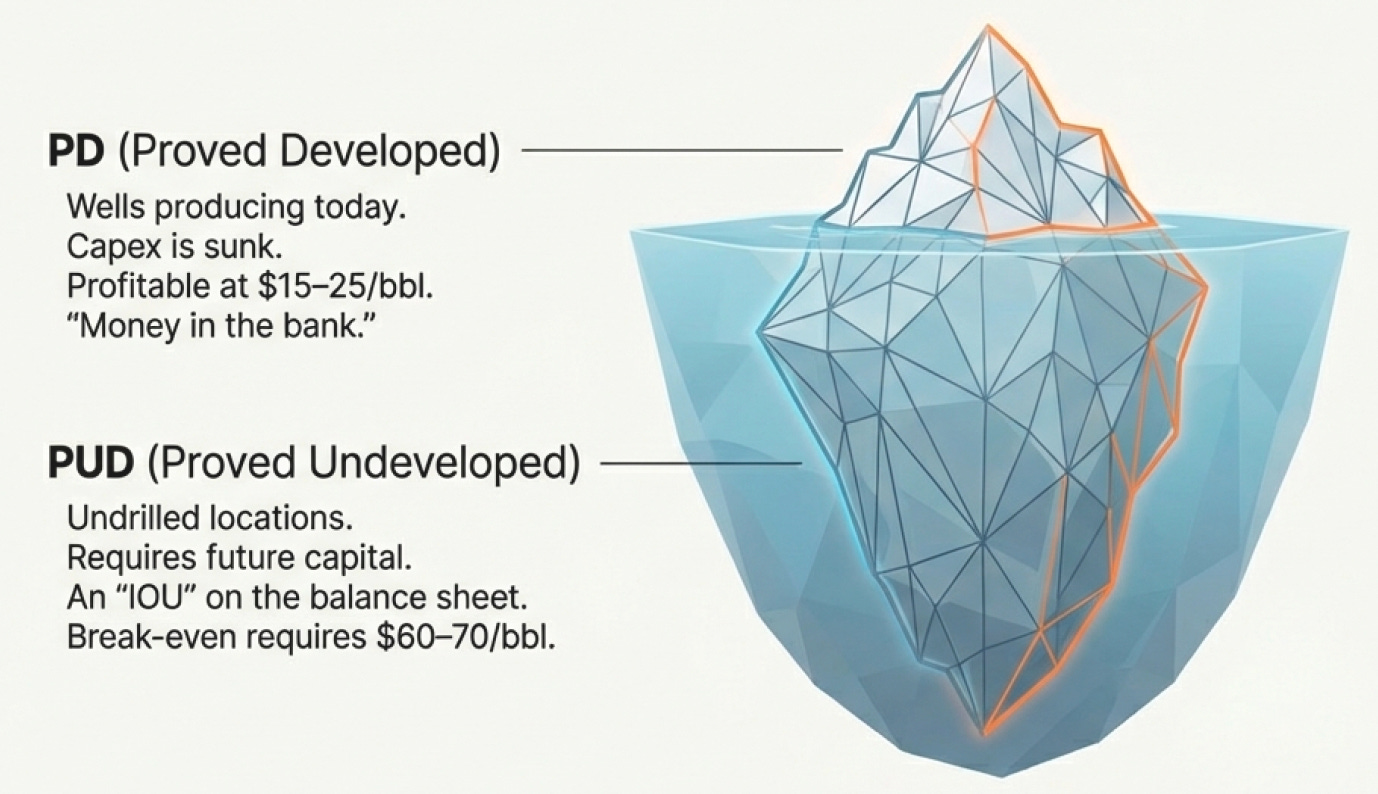
Proved Developed (PD) Producing Reserves: Oil flowing today from existing wells. This is money in the bank—requires minimal additional capex, just operating expenses.
Proved Developed Non-Producing (PDNP) Reserves: Wells are drilled but temporarily shut in or awaiting completion. Requires some capex to bring online, but infrastructure is mostly in place.
Proved Undeveloped (PUD) Reserves: Oil is there (90% certainty), but wells haven’t been drilled yet. Requires significant future capex. This is the “IOU” on the balance sheet.
Unproven Reserves (Probable and Possible): The hopeful numbers. Maybe they’re there, maybe they’re not. Maybe they’ll be economically viable, maybe they won’t.
Here’s why this matters practically: In December 2014, when oil crashed from $100/barrel to $50/barrel in six months, companies with mostly PD reserves kept generating cash flow. Wells were already drilled. Operating costs were $15-25/barrel. Even at $50 oil, they were profitable.
Companies with mostly PUD reserves were destroyed. They needed $60-70/barrel oil to justify drilling new wells. At $50 oil, their “reserves” were economically worthless. Their stock prices fell 70-80%.
Same “proven reserves” on paper. Completely different business realities.
The Midstream Mystery - Where Nobody Gets Rich, But Somebody Has To Do It
Now our oil molecule needs to get from West Texas to a refinery on the Gulf Coast. This is where midstream comes in.
Midstream is the unglamorous middle child of the energy family. Not as sexy as upstream (finding oil!), not as consumer-facing as downstream (gas stations!). Just... moving stuff around.
But here’s the thing: Midstream might be the most interesting business model in the entire industry, precisely because it’s so boring.
Think about what midstream companies actually do:
Gathering Systems: Small pipelines that collect oil and gas from multiple wells in a field and bring them to a central point. Picture tree branches merging into the trunk.
Processing Plants: Facilities that separate natural gas into its components (methane, ethane, propane, butane) and remove impurities like water, CO2, and hydrogen sulfide.
Transmission Pipelines: Large pipelines that move oil and gas hundreds or thousands of miles from production areas to markets.
Storage Facilities: Underground salt caverns, depleted reservoirs, or above-ground tanks that hold oil and gas until it’s needed.
Export Terminals: Facilities that cool natural gas to -162°C, turning it into LNG for shipping overseas.
Now here’s what makes midstream fascinating from a business perspective: Midstream companies typically don’t own the molecules. They own the infrastructure and charge a fee for moving or storing them.
This creates completely different economics than upstream or downstream.
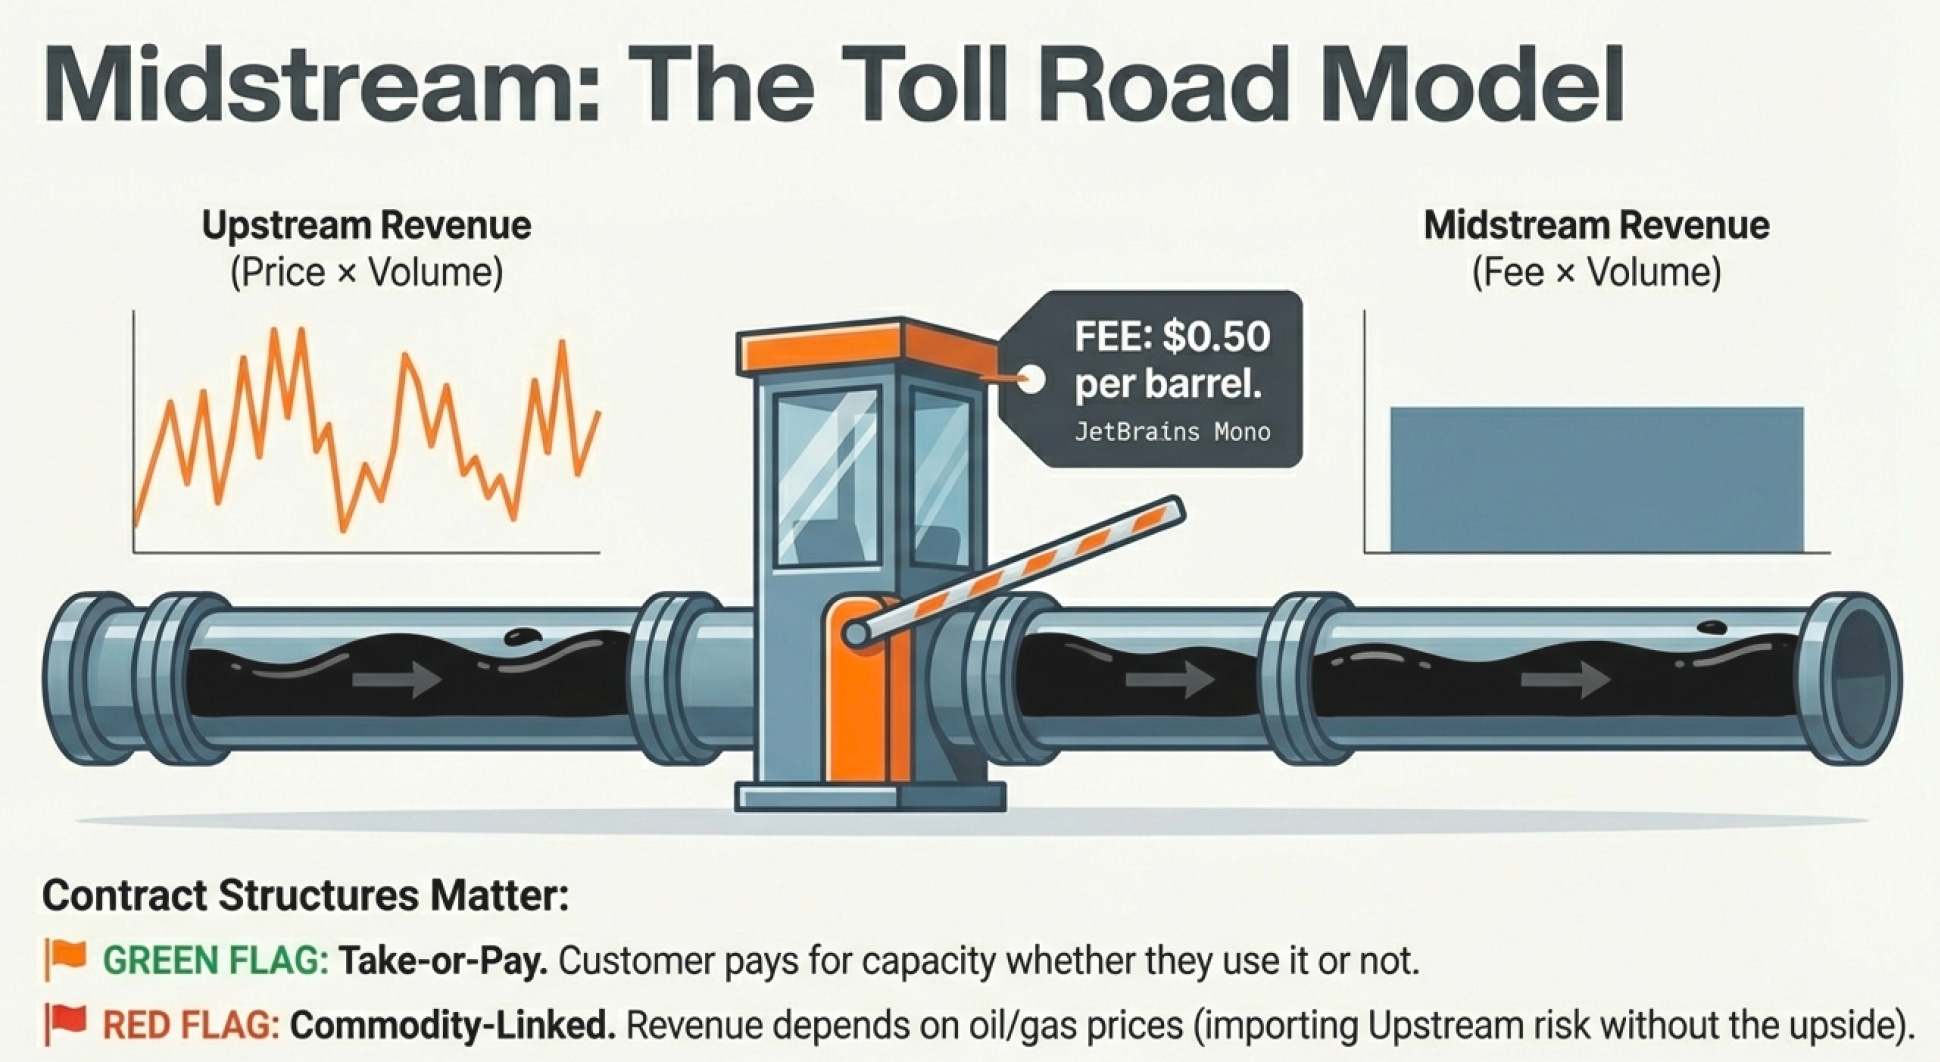
An upstream company’s revenue depends entirely on commodity prices. Oil at $80/barrel? Great. Oil at $50/barrel? Terrible.
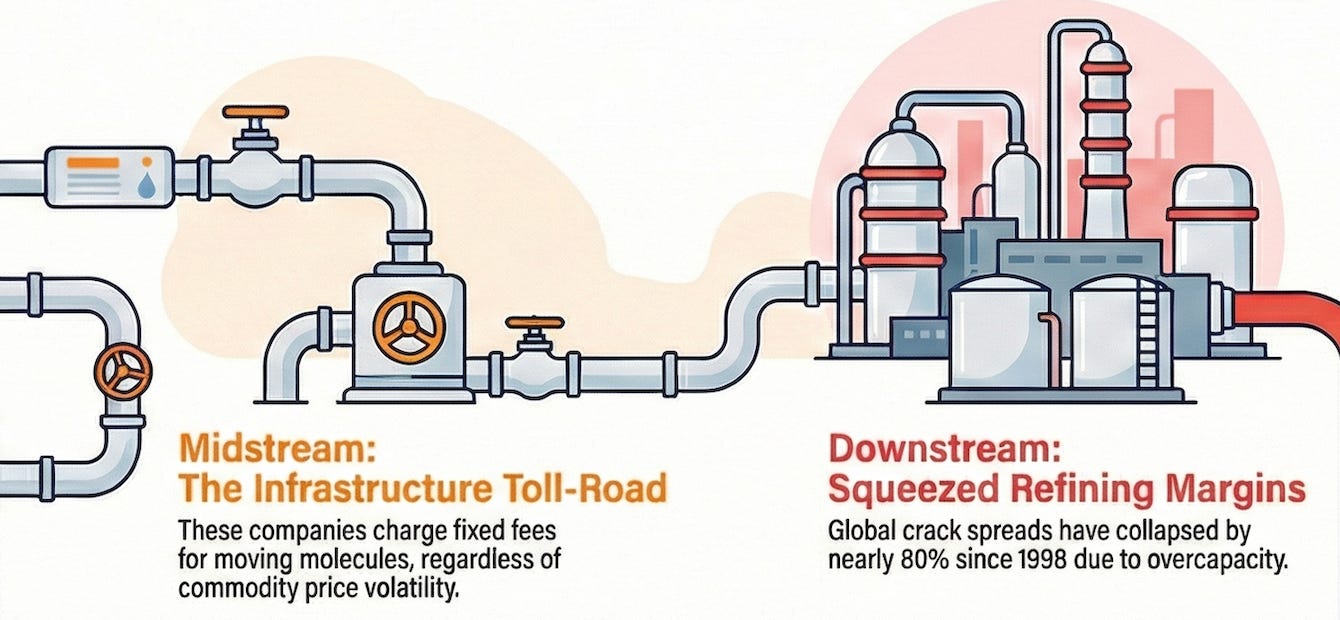
A midstream company charges based on volume, not price. They might charge $0.50 per barrel to move oil through their pipeline, or $0.15 per MMBtu to move gas. Whether oil is $80 or $50, they get their $0.50.
This is why midstream companies often structure as Master Limited Partnerships (MLPs)—they generate steady, predictable cash flows that can be distributed to investors as dividends.
Kinder Morgan, one of North America’s largest midstream companies, operates 83,000 miles of pipelines and 141 terminals. In 2023, they moved 40% of all natural gas consumed in the United States. Their business model is simple: charge a toll for using the infrastructure.
But here’s the catch: Midstream depends completely on upstream supply. If wells stop producing (because prices are too low or reserves are depleted), pipelines run empty. A pipeline at 50% capacity still has the same fixed costs as one at 100% capacity, but half the revenue.
This is why midstream companies obsess over contract structures. The best midstream contracts are:
Take-or-Pay: The customer agrees to pay for a certain volume whether they use it or not. This guarantees midstream revenue even if production falls.
Long-Term: 10-20 year contracts provide revenue visibility and justify the massive infrastructure investments.
Fee-Based: Payment is per-unit-moved, insulating midstream from commodity price volatility.
The worst midstream contracts are commodity-linked, where revenue depends on oil or gas prices. This defeats the entire purpose of midstream’s business model—you get upstream risk without upstream upside.
The Midstream Bottleneck - Geography
Here’s a story that illustrates why midstream infrastructure matters enormously.
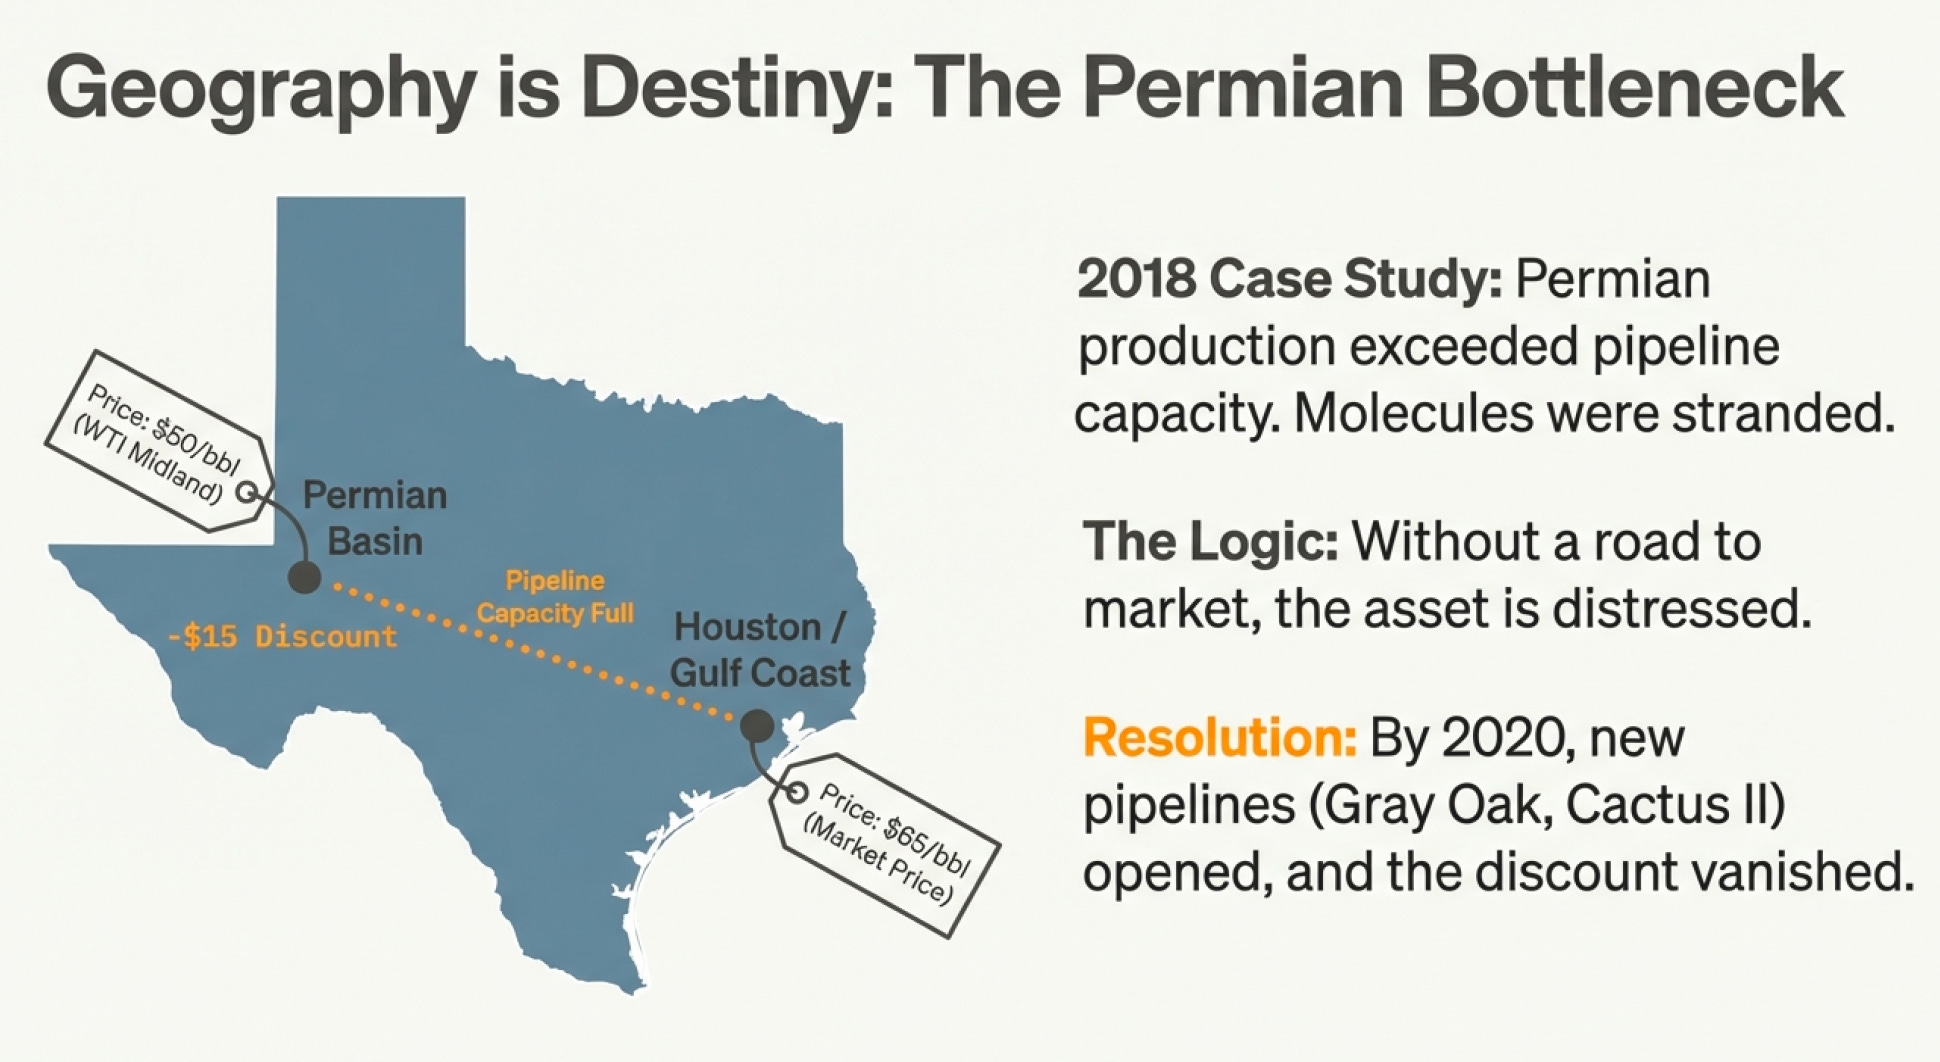
In 2018, the Permian Basin was producing so much oil that local pipeline capacity was exceeded. Producers had oil but couldn’t get it to refineries. The local price for Permian crude (called WTI Midland) fell to a $15/barrel discount to Gulf Coast prices.
Think about that. Oil in West Texas was selling for $15/barrel less than identical oil 400 miles away in Houston. Why? No pipeline capacity. The molecules were stranded.
Companies with pipeline capacity made a fortune moving oil from West Texas to the Gulf Coast. Companies producing oil in the Permian without pipeline contracts lost $15/barrel on every barrel they produced.
By 2020, multiple new pipelines were completed (Epic Crude, EPIC Y-Grade, Gray Oak Pipeline, Cactus II expansion). Suddenly, the discount disappeared. Permian oil returned to market pricing.
The lesson: Midstream infrastructure can create or destroy billions in value, even when the oil itself is identical.
This is why integrated players have an advantage. If you own upstream production AND midstream infrastructure, you capture value at both levels. If you’re a pure-play producer relying on third-party pipelines, you’re at their mercy when capacity is tight.
The Downstream Dilemma - Why Turning Oil Into Gasoline Doesn’t Make Much Money
Finally, our oil molecule arrives at a refinery on the Gulf Coast. Time to turn crude oil into something useful.
Refineries are chemical factories that use heat, pressure, and catalysts to break long hydrocarbon chains into shorter ones (like gasoline) or rearrange them into different products (like jet fuel, diesel, asphalt, lubricants, and petrochemical feedstocks).
The process is technically impressive. A modern refinery like ExxonMobil’s Baytown facility in Texas can process 584,000 barrels per day of crude oil into 40+ different products. It operates 24/7/365, employs 7,000 people, and required $10+ billion to build.
And yet, refineries are terrible businesses.
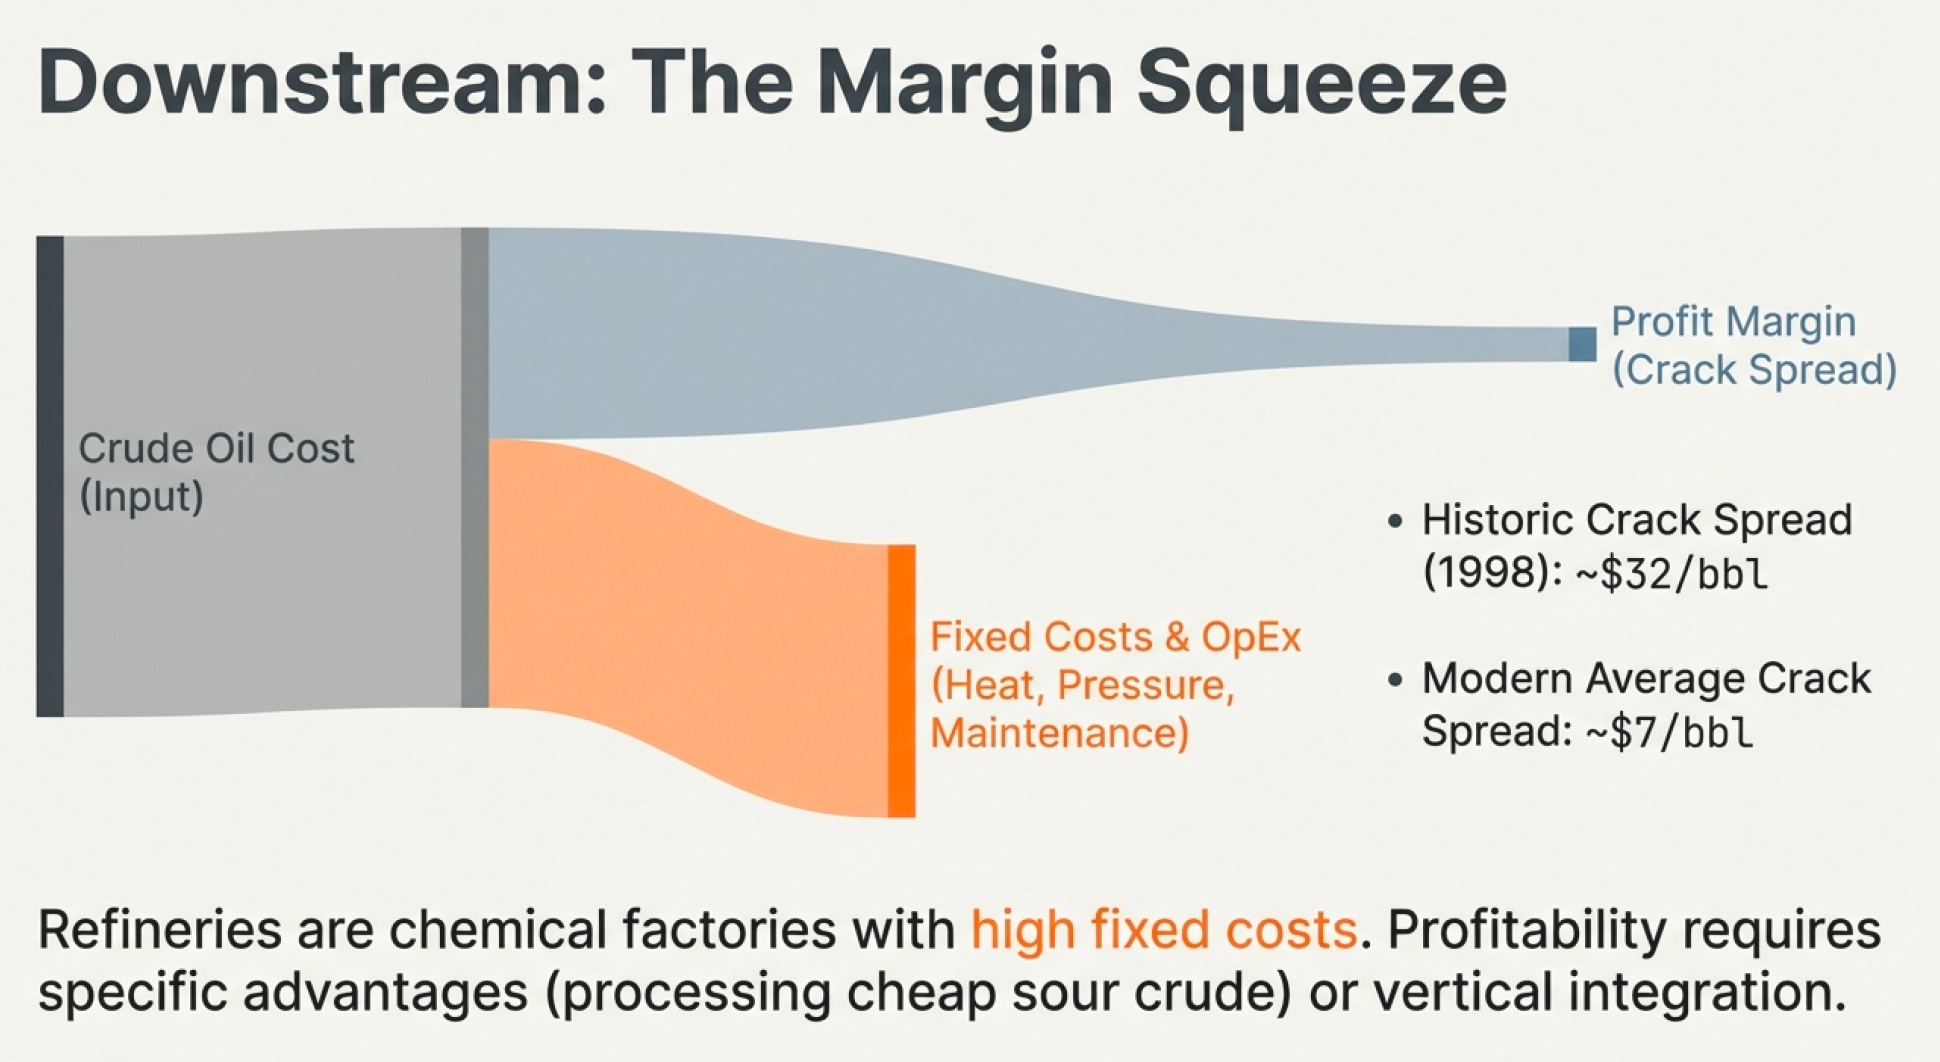
Remember crack spreads? The profit margin refiners earn has collapsed from $31.98/barrel in 1998 to around $7/barrel today—a 78% decline.
Why?
Overcapacity: Too many refineries competing for crude oil supply. When you have excess capacity, you compete on price. Margins get squeezed.
High Fixed Costs: A refinery costs billions to build and requires constant maintenance. Whether you’re running at 70% capacity or 95% capacity, most costs are the same.
Commodity Business: One refinery’s gasoline is indistinguishable from another’s. There’s no brand loyalty, no pricing power. It’s pure commodity economics.
Regulatory Burden: Environmental regulations require continuous investment in emissions controls, safety systems, and process modifications. These costs have increased dramatically over the past 20 years.
The result? Even though refineries are “closer to the consumer” than upstream, they often earn lower returns.
Shell, BP, TotalEnergies—all the major integrated companies—have been selling or closing refineries for years. Why own a low-margin refining business when you could redeploy that capital into higher-return upstream assets?
But here’s the twist: Refineries can be good businesses if you have specific advantages:
Configuration: Refineries designed to process cheap heavy sour crude (like Canadian bitumen) while producing high-value light products earn higher margins than simple refineries.
Location: Refineries on the Gulf Coast with access to both domestic crude and export markets for refined products have more optionality than isolated inland refineries.
Integration: If you own oil production, pipelines to move it, and refineries to process it, you can optimize across the value chain rather than paying market prices at each step.
Phillips 66, spun out from ConocoPhillips in 2012, operates 12 refineries with total capacity of 2.2 million barrels per day. They’ve invested heavily in coking capacity (which processes heavy crude) and in exporting refined products to Latin America and Asia. Their refining margins consistently beat industry averages—not because they’re magically better at refining, but because they’ve positioned their assets strategically.
The Data That Actually Matters
Now that we understand the three-part structure, let’s talk about the data points that reveal what’s really happening in real-time.
These aren’t predictive models or forecasts. These are measurements of physical reality—what’s moving through pipelines, what’s sitting in storage, what’s being drilled today.
The Baker Hughes Rig Count
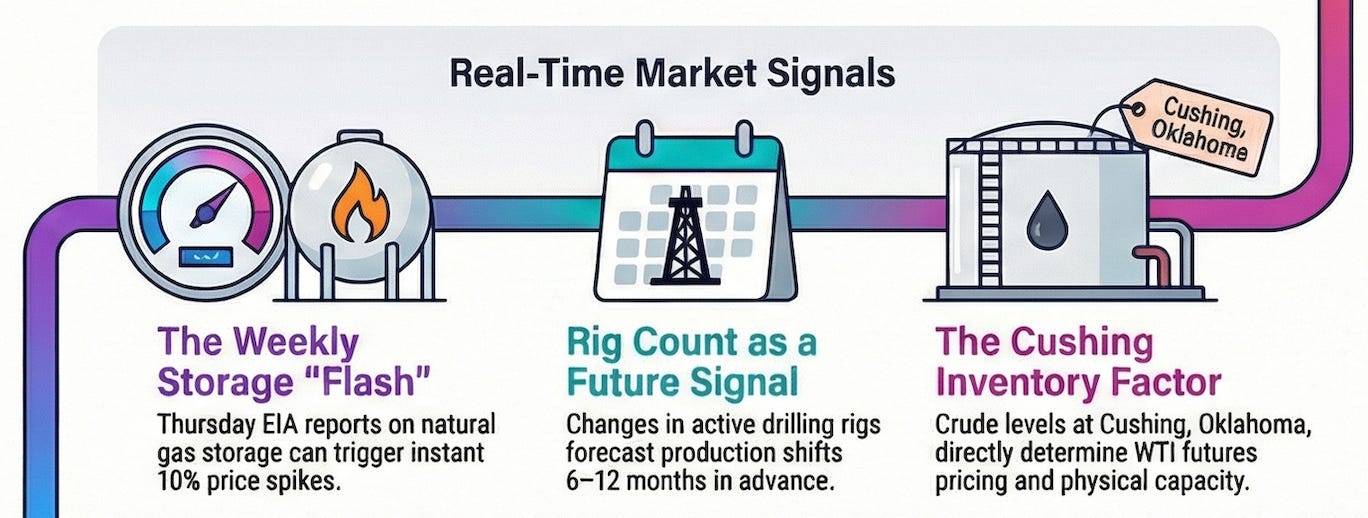
Published every Friday, this shows how many drilling rigs are actively working in the United States and Canada, broken down by region and whether they’re drilling for oil or gas.
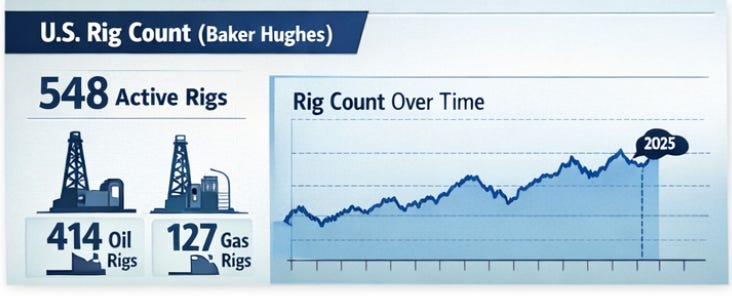
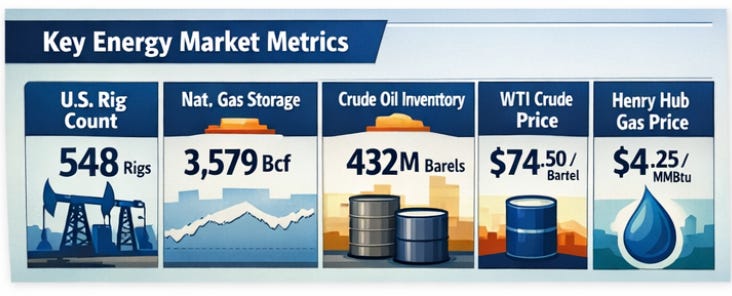
As of December 2025, the total U.S. rig count is 548 rigs (414 oil-directed, 127 gas-directed, 7 miscellaneous). This is down from 589 rigs a year ago.
Why does this matter? Because rig count is what companies are actually doing with their capital right now. Not what they say in press releases about long-term plans. What they’re doing today.
When the rig count drops sharply, it means operators believe current prices don’t justify drilling. Production won’t fall immediately (existing wells keep producing), but in 6-12 months, production will start declining as existing wells decline and fewer new wells are drilled to offset them.
When the rig count rises sharply, operators believe prices justify increased drilling. Production will rise in 6-12 months.
It’s a real-time capital allocation signal.
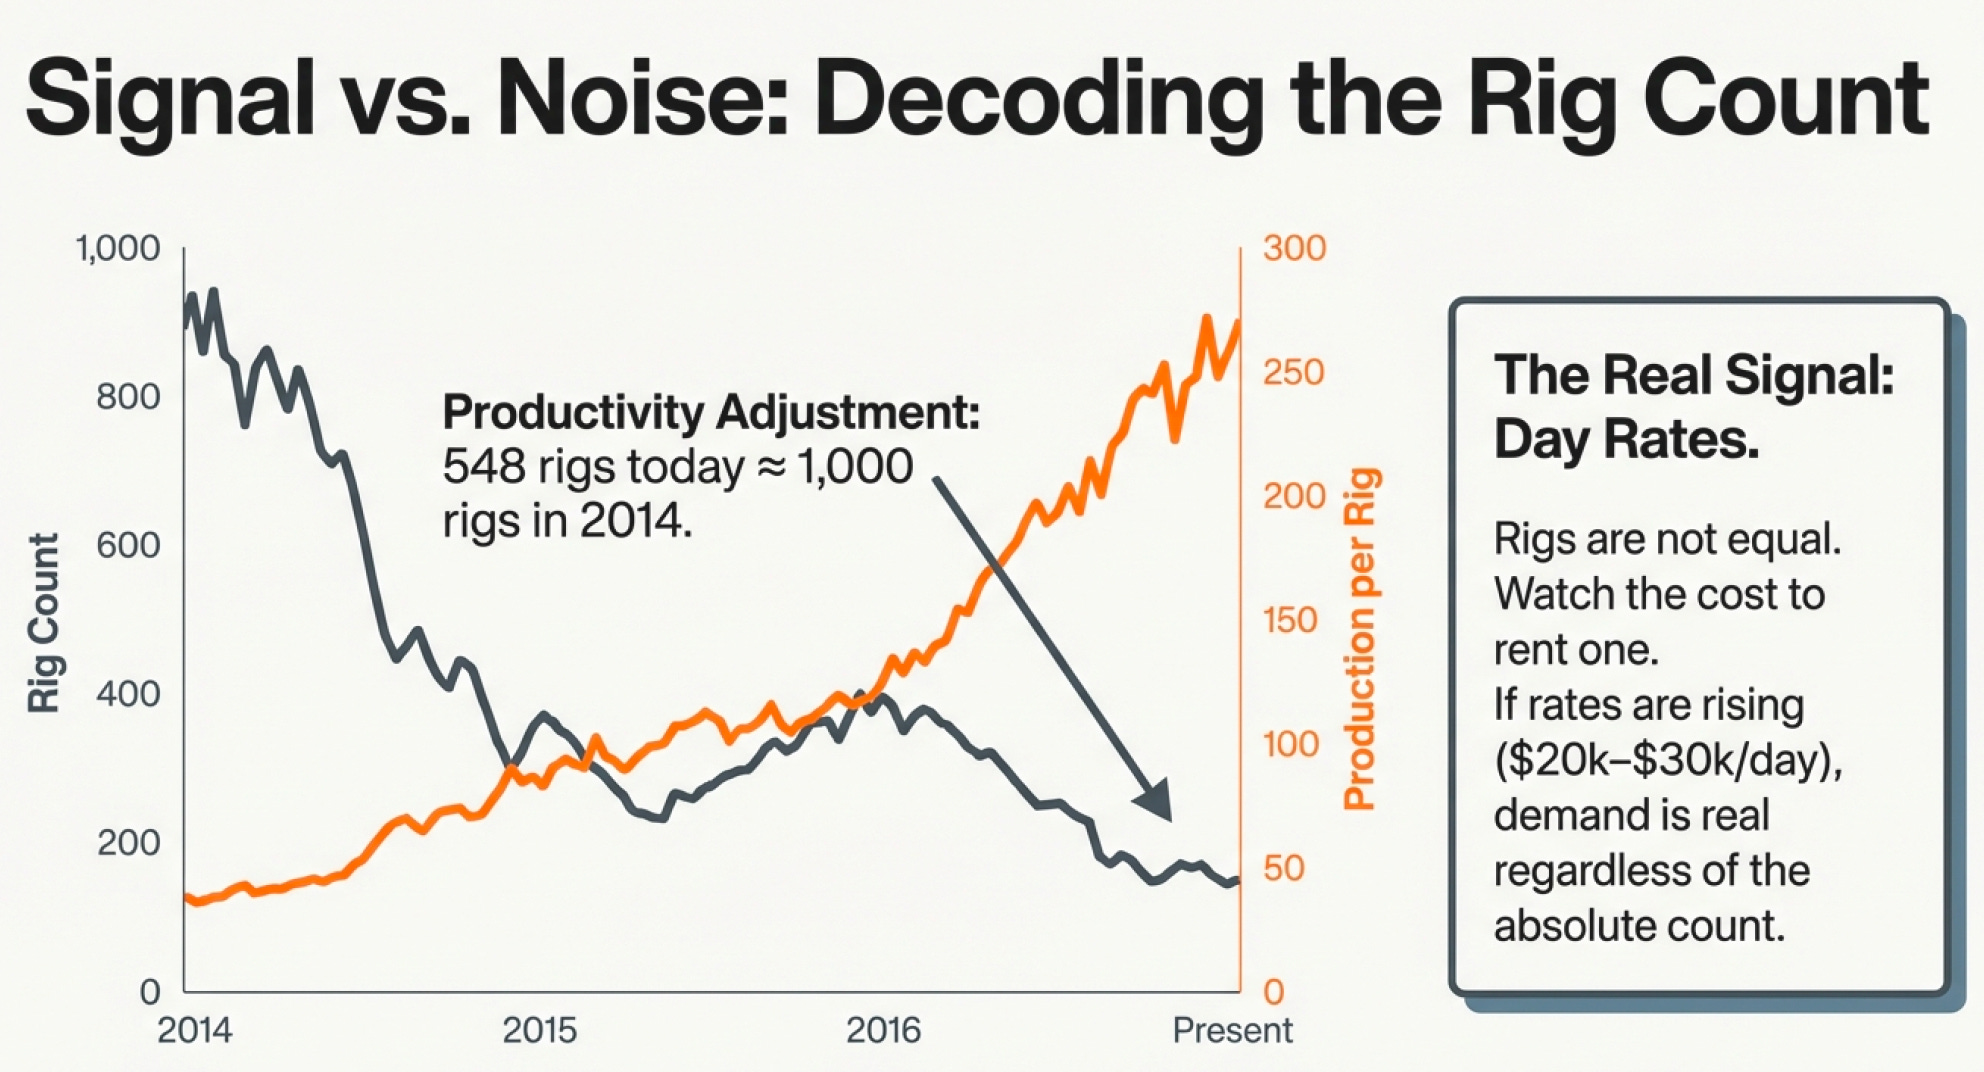
But here’s the nuance: Not all rigs are equal. Modern rigs can drill multiple wells simultaneously or drill longer laterals (the horizontal portion of the well). A rig today can accomplish what three rigs could in 2010.
So you can’t just compare today’s 548 rigs to 2014’s 1,600 rigs directly. You need to adjust for productivity improvements. On a productivity-adjusted basis, 548 rigs today might be equivalent to 900-1,000 rigs from 2014.
This is why you should also watch day rates—the cost to contract a rig. When day rates are rising (currently $20,000-30,000/day for land rigs), demand for rigs is strong. When day rates are falling, demand is weak. Price tells you more than quantity sometimes.
The Weekly Natural Gas Storage Report
Every Thursday at 10:30 AM, the EIA reports how much natural gas went into or out of storage the previous week.
As of December 12, 2025, working gas in storage was 3,579 Bcf, with a net withdrawal of 167 Bcf. This is 32 Bcf (1%) more than the five-year average and 61 Bcf (2%) lower than last year.
Here’s why this number is so powerful: Natural gas demand is highly seasonal. You burn gas to heat homes in winter. Storage levels relative to seasonal norms tell you whether supply and demand are balanced.
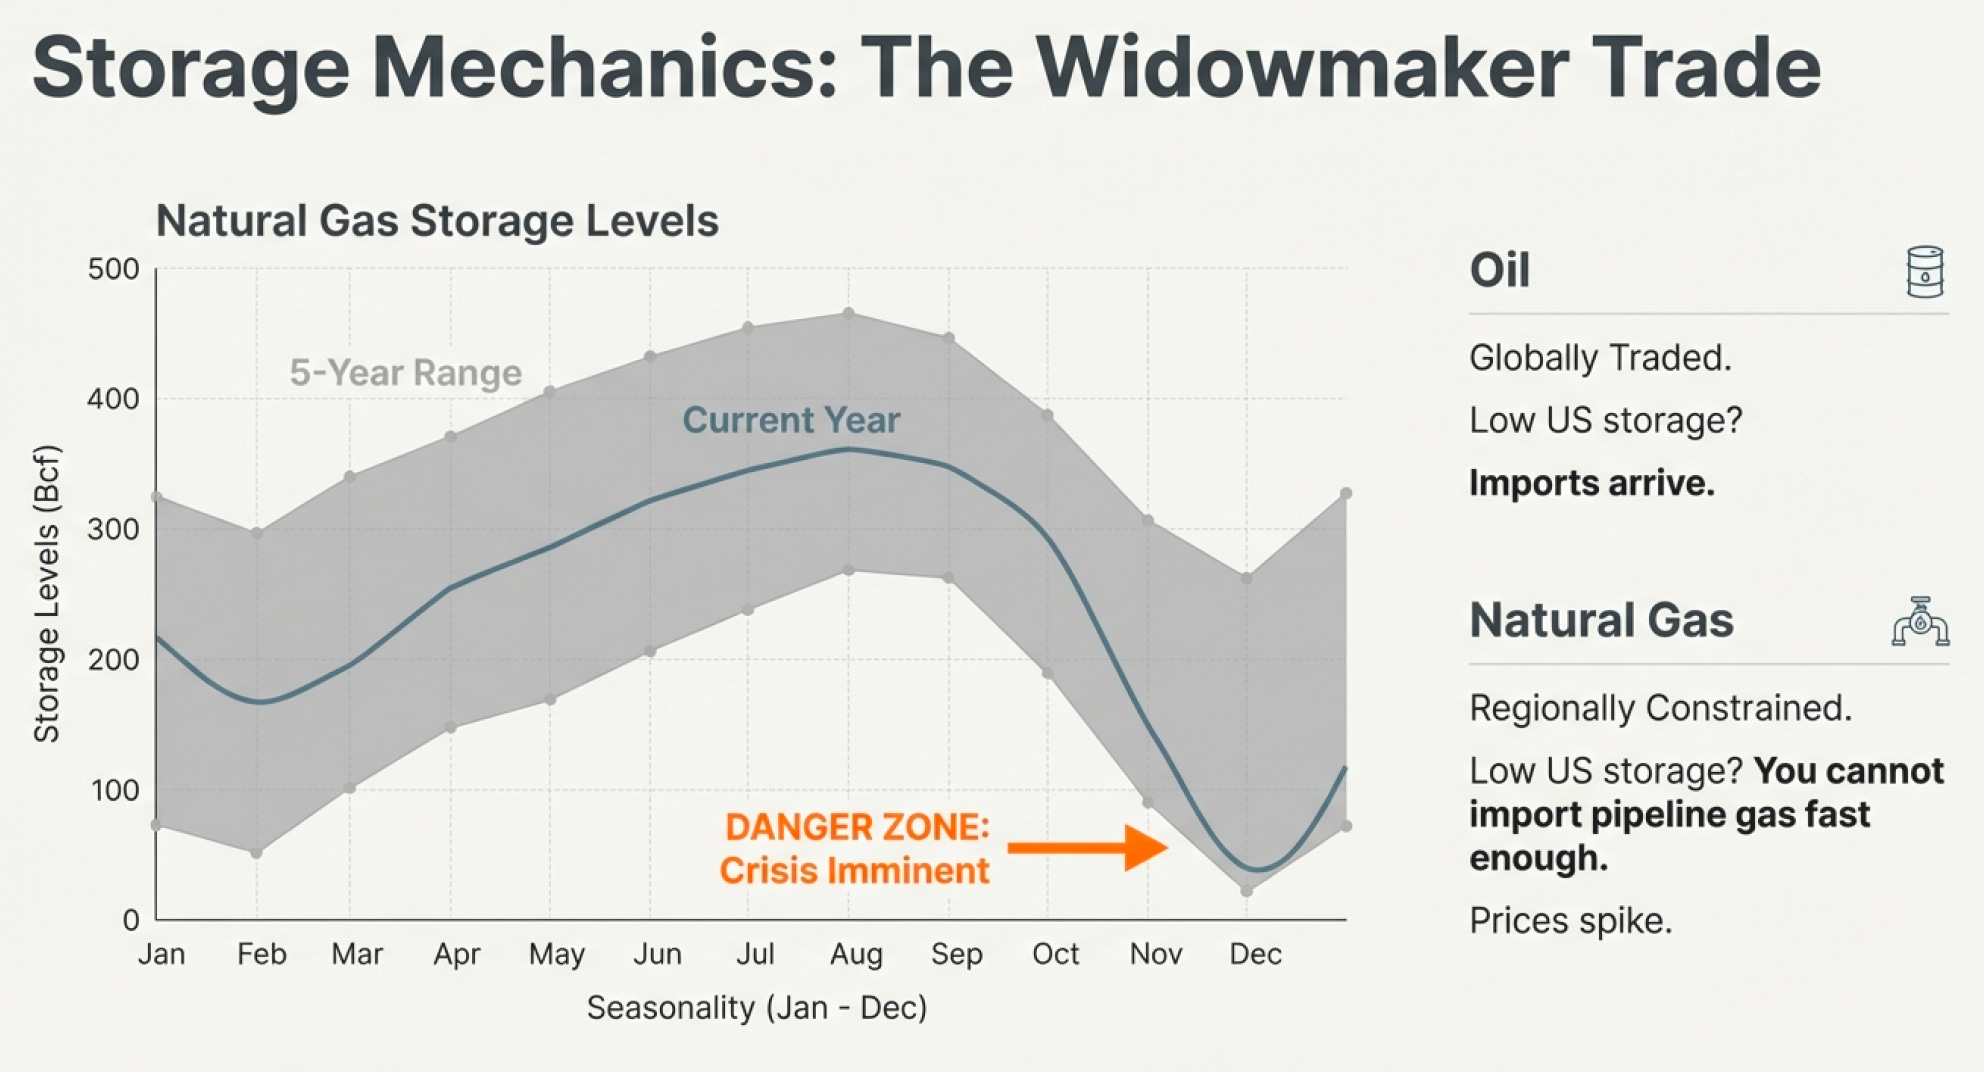
If storage is below the five-year average heading into winter, the market lacks a cushion. If winter is colder than expected, prices will spike—potentially dramatically. If storage is above average, there’s plenty of supply even if winter is cold.
Compare this to oil, where the Weekly Petroleum Status Report shows crude oil inventories. But oil storage matters less because oil is globally traded. If U.S. storage is low, you can import oil relatively easily. Natural gas is regionally constrained—you can’t quickly import pipeline gas if U.S. storage is depleted.
This is why Brian Hunter at Amaranth lost $6 billion in 2006 betting on natural gas storage dynamics. He thought winter would be cold and storage was too low, so he bet prices would spike. Winter was mild. Storage stayed high. Prices fell. His positions were too large. Game over.
Storage reports are how the market constantly recalibrates supply-demand expectations based on actual physical reality rather than forecasts.
The Weekly Petroleum Status Report
Published every Wednesday, this shows U.S. crude oil production, imports, exports, refinery utilization, and inventory levels.
Current U.S. crude oil production is running around 13.2 million barrels per day, near all-time highs. Refinery utilization is approximately 90%—refineries are running hard.
The key number everyone watches: crude oil inventories at Cushing, Oklahoma. This is the delivery point for WTI futures contracts. When Cushing storage fills up, WTI prices get pressured lower (nowhere to put the oil). When Cushing inventories are drawn down, prices firm up.
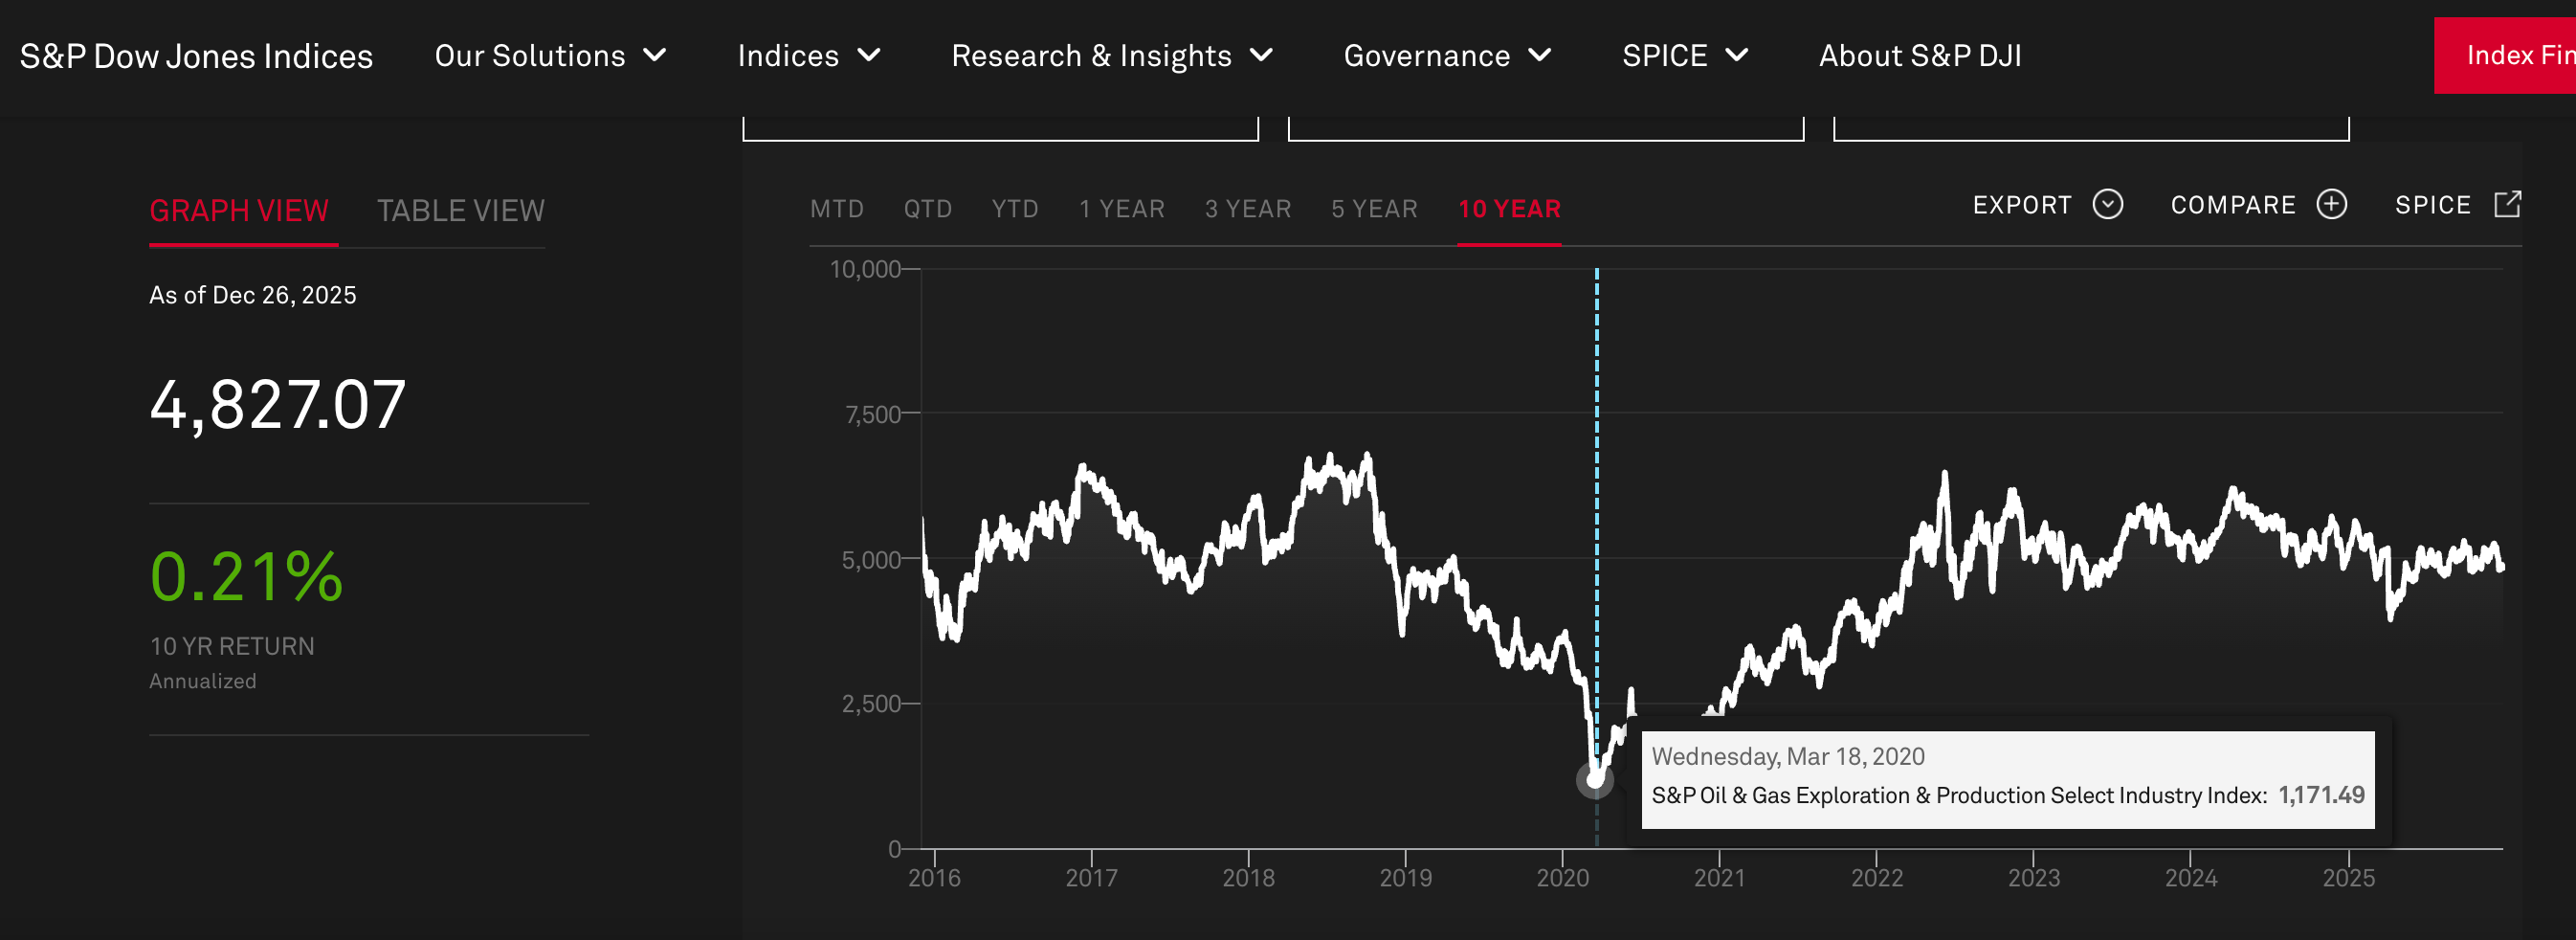
In 2020, Cushing nearly filled to capacity during the COVID demand collapse. Oil prices went negative (yes, negative) for a brief period because there was literally nowhere to store additional oil and producers couldn’t shut in wells fast enough.
The EIA Monthly Energy Reports
Beyond weekly reports, the EIA publishes monthly data on:
Drilling Productivity Report: Shows how much oil and gas new wells produce on average in major shale plays, and how fast existing wells are declining. Essential for understanding production trends.
Petroleum Supply Monthly: Detailed refinery inputs and outputs, showing what products are being produced and where demand is.
Natural Gas Monthly: Comprehensive production, consumption, and trade data.
These aren’t as timely as weekly reports, but they provide deeper detail and context.
OPEC Production Reports
The Organization of Petroleum Exporting Countries publishes monthly reports on member country production. Since OPEC+ (OPEC plus Russia and allies) controls about 40% of global oil production, their decisions on production quotas directly impact prices.
OPEC meetings are theater—everyone knows the numbers are negotiated ahead of time. But the actual production data (measured by secondary sources, not self-reported) reveals whether members are complying with quotas or cheating.
When compliance is high, OPEC can effectively manage supply. When compliance is low (members produce more than their quota), prices face downward pressure despite official cuts.
The Five Metrics That Matter Most
With all these data sources, what should you actually watch?
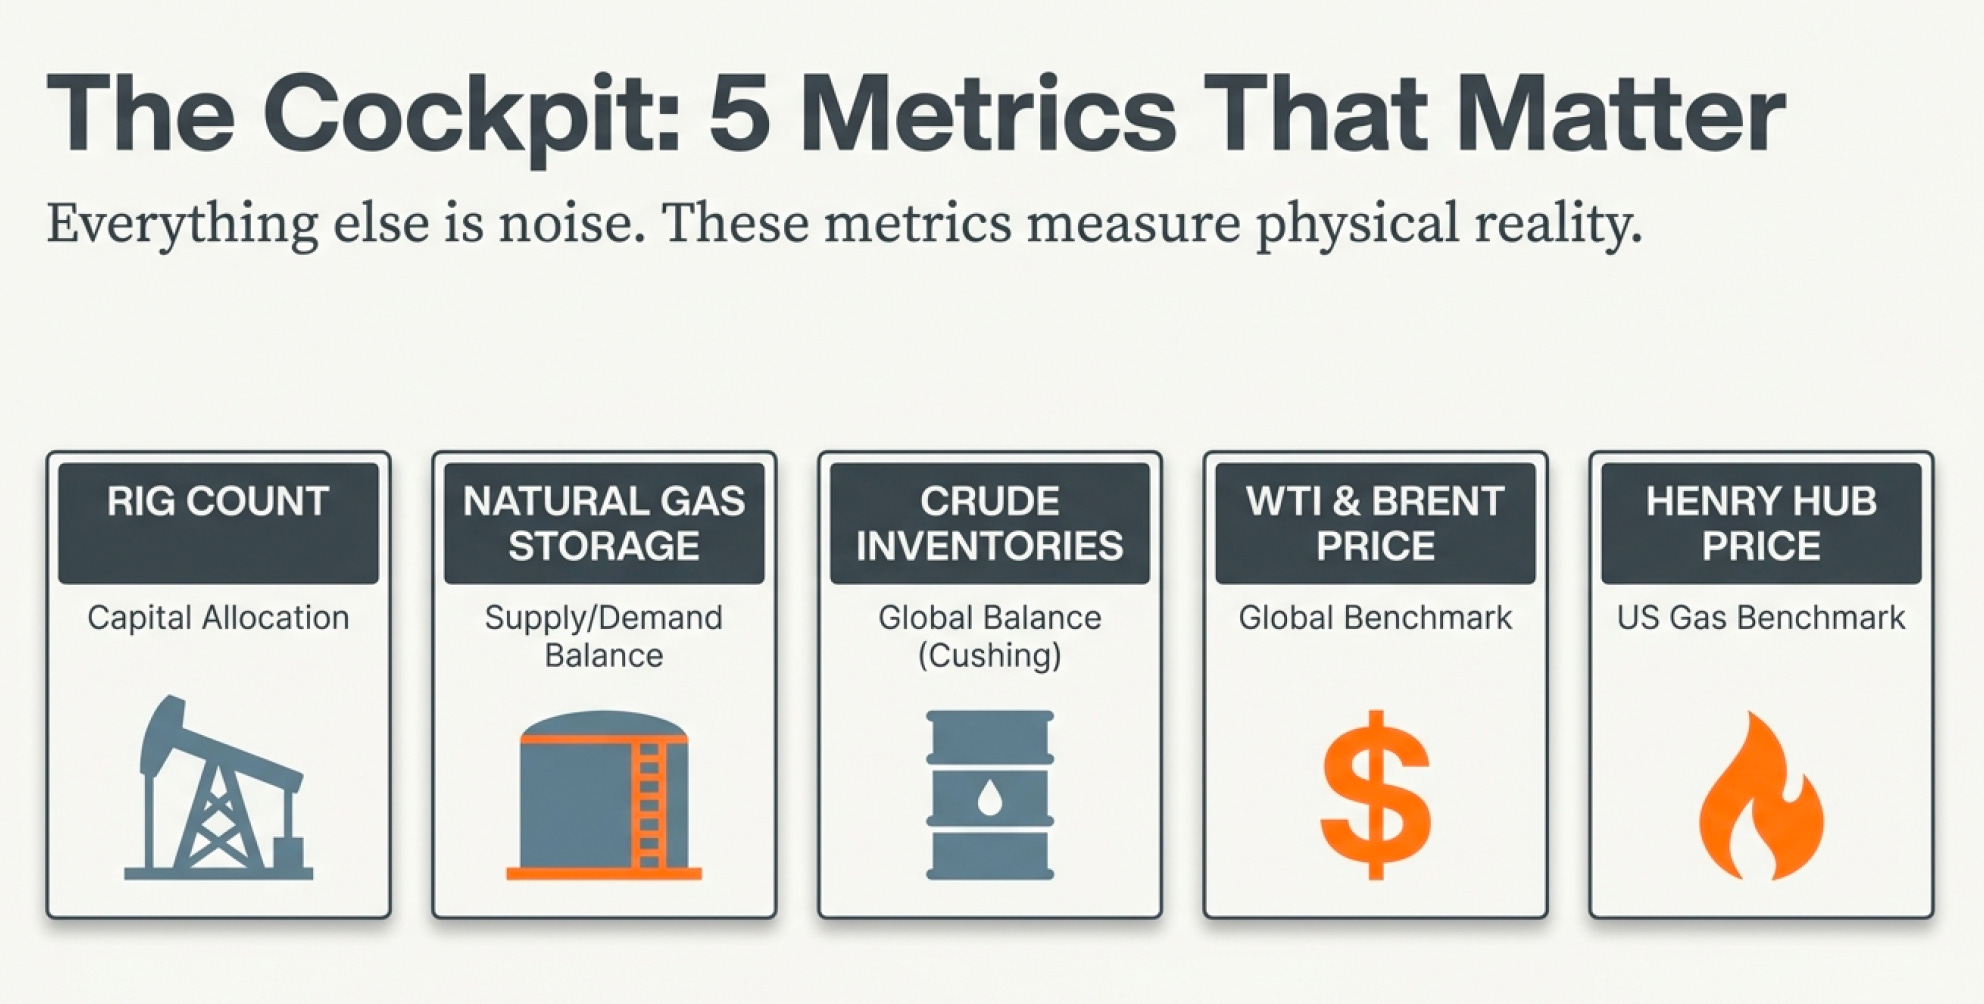
If I could only track five metrics for the entire fossil fuel industry, here’s what they’d be:
1. U.S. Rig Count (Baker Hughes, weekly): Tells you what operators believe about future prices based on their current capital spending.
2. Natural Gas Storage (EIA, weekly): Tells you whether gas supply-demand is balanced relative to seasonal norms.
3. Crude Oil Inventories (EIA, weekly): Tells you whether oil supply-demand is balanced.
4. WTI and Brent Crude Prices: The spot prices for benchmark oils. Everything else is derived from these.
5. Natural Gas Price (Henry Hub): The U.S. benchmark natural gas price.
Everything else—production forecasts, demand projections, geopolitical analysis—is noise unless you understand what’s happening right now in these five metrics.
Why You Can’t Understand One Without the Others
Here’s where it gets really interesting. These three segments—upstream, midstream, downstream—and all these data points don’t exist in isolation. They’re connected in ways that create feedback loops and cascading effects.
Example 1: The Shale Bottleneck Cascade
Upstream operators drill more wells in the Permian (rig count rises)
Production increases faster than pipeline capacity
Midstream becomes congested, local prices fall (Permian oil trades at a discount)
Upstream drilling economics deteriorate (lower realized prices)
Operators slow drilling (rig count falls)
Production growth slows
Pipeline capacity catches up
Prices normalize
Operators increase drilling again
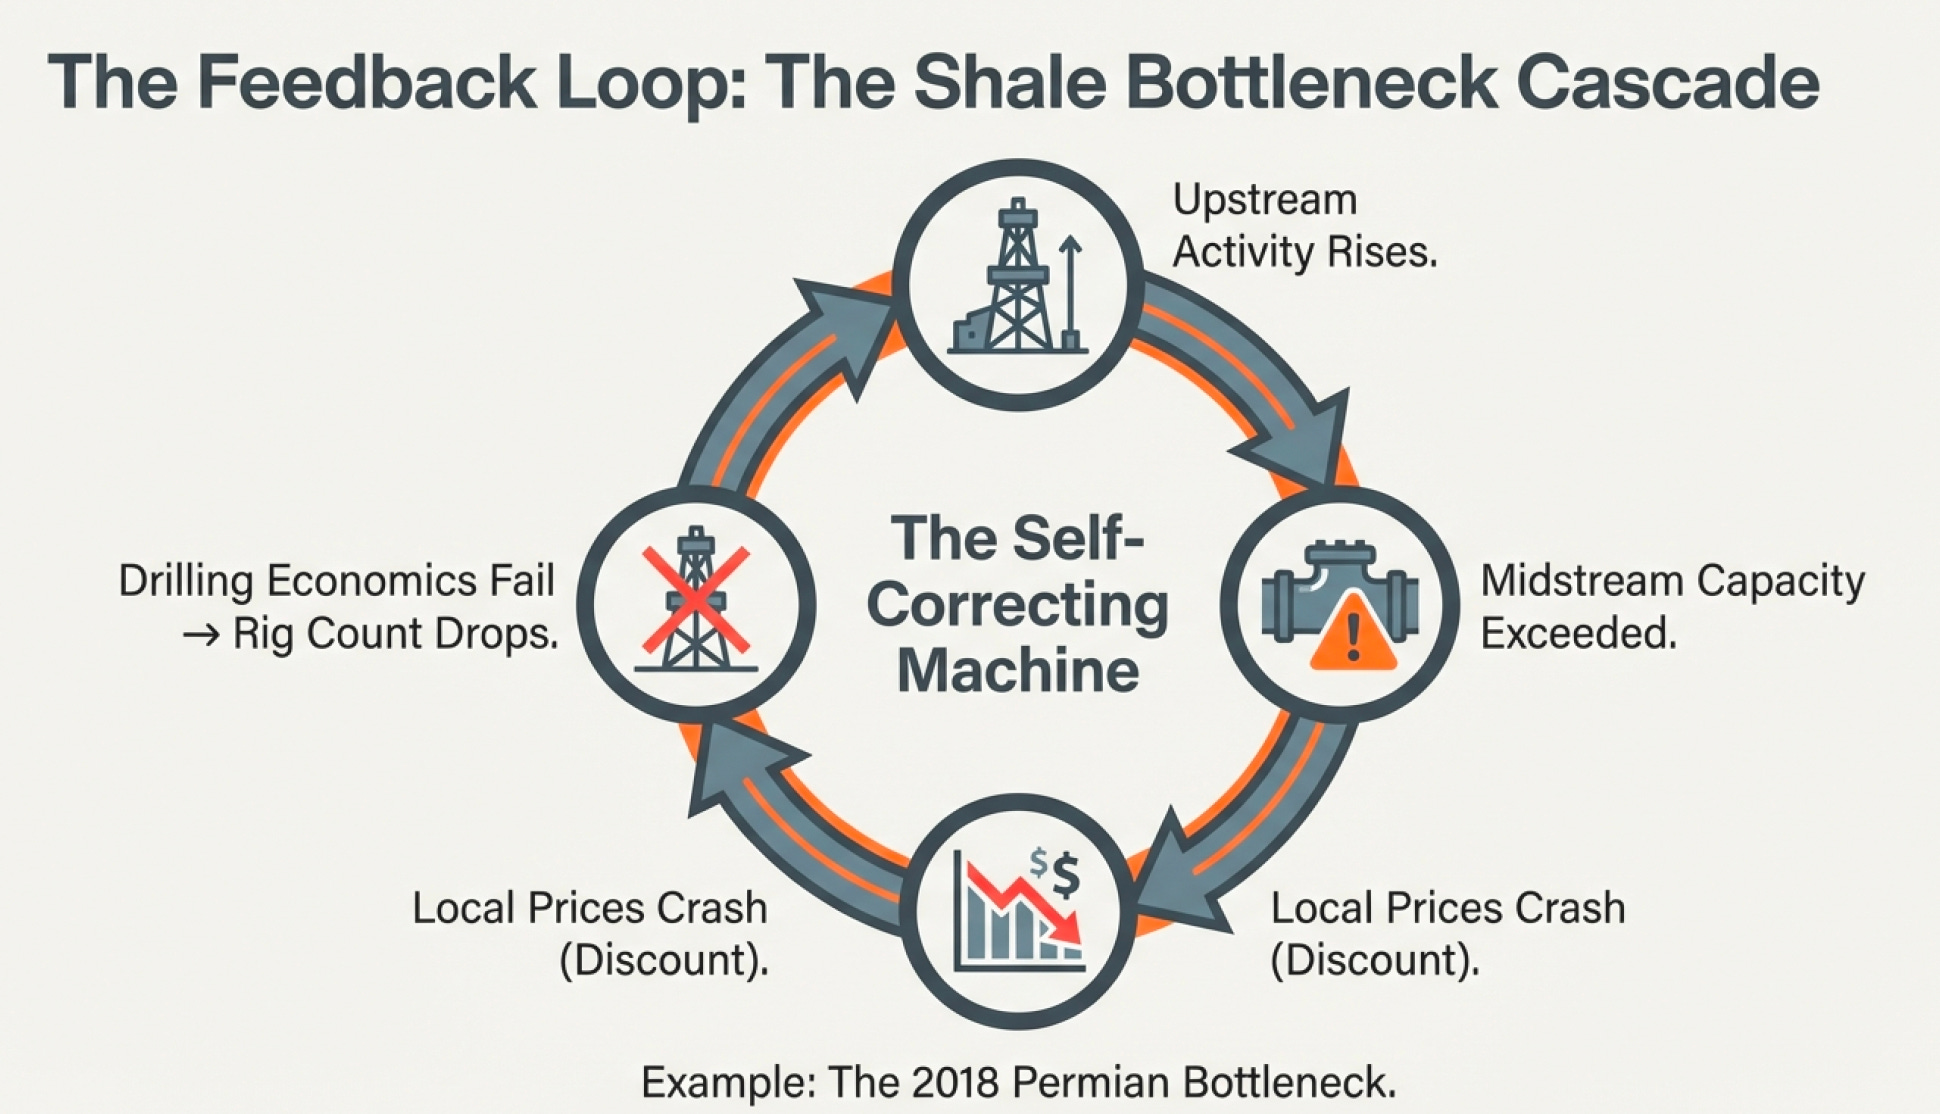
This cycle has repeated multiple times in the Permian. Understanding it requires watching rig counts (upstream activity), pipeline capacity (midstream constraints), and price differentials (market signals).
Example 2: The Winter Gas Crunch
Cold weather forecast for Eastern U.S.
Natural gas storage withdrawals accelerate (weekly storage report shows bigger draws)
Henry Hub price spikes
Gas-fired power plants become more expensive to run than coal plants
Utilities switch from gas to coal where possible (coal production increases)
Gas demand from power generation falls slightly
Storage withdrawals slow
Prices stabilize
This shows how natural gas, coal, and electricity markets are interconnected. A cold winter doesn’t just affect gas—it affects the entire energy system.
Example 3: The Export Boom
U.S. shale production grows (rig count up, weekly production reports show increases)
Domestic crude oil prices fall relative to international prices (WTI-Brent spread)
U.S. lifts crude oil export ban in 2015
Exports surge (weekly petroleum report shows rising exports)
Domestic inventories fall
WTI-Brent spread narrows
U.S. producers get better prices
Economics improve, drilling increases further
This is how changes in one part of the system (regulatory policy allowing exports) ripple through the entire industry.
Why Good Assets Don’t Always Mean Good Investments
Let’s bring this back to evaluating actual companies. You’re looking at an upstream company’s investor presentation. They show:
500 million BOE of proven reserves
Production of 150,000 BOE/d
Located in top-tier shale plays
Sounds great. But here’s what you actually need to know:
1. Asset Quality
What percentage of those 500 million BOE are PD (Proved Developed) versus PUD (Proved Undeveloped require future capital)?
What’s the oil/gas mix? (Remember, oil is worth 4-6x gas on an energy-equivalent basis)
What’s the oil quality? (Light sweet commands premiums, heavy sour sells at discounts)
2. Capital Requirements
What’s the reinvestment rate? (Percentage of cash flow needed to maintain production e.g. what is the type of oil, is it shale?)
What’s the finding and development cost? (Cost per BOE to add reserves)
What’s free cash flow at $60 oil? At $70 oil? At $80 oil?
3. Balance Sheet Health
What’s the debt level relative to cash flow?
What’s the debt maturity schedule? (Do they have refinancing risk?)
What’s their hedge position? (Have they locked in prices for future production?)
4. Midstream Access
Do they own pipeline capacity, or are they at the mercy of third parties?
What’s their realized price relative to benchmark? (Tells you about transportation costs and market access)
5. Operational Efficiency
What’s their production cost per BOE?
How does it compare to peers in the same basin?
What’s the trend—improving or deteriorating?
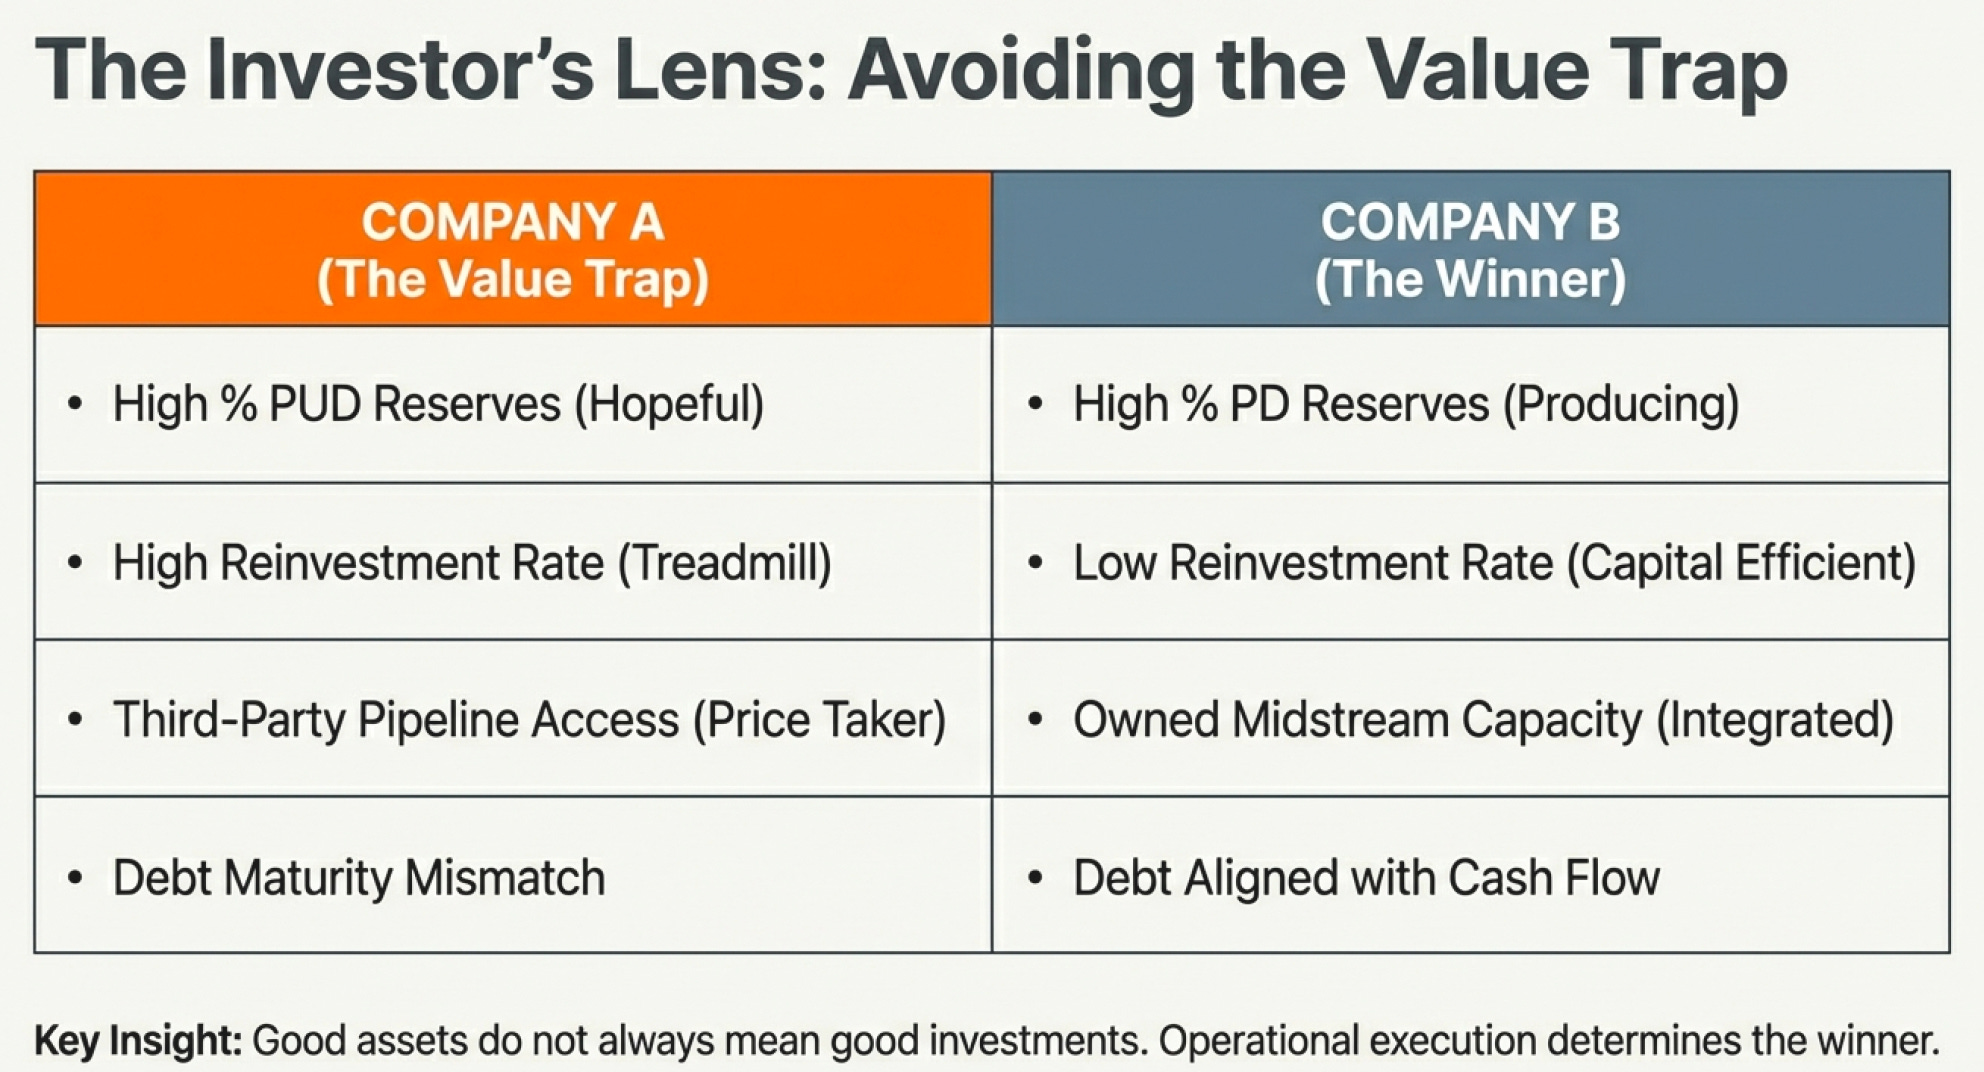
A company might have amazing reserves but terrible economics because:
Most reserves are PUD requiring $2 billion in future capex
They’re over-levered with $3 billion in debt
They lack pipeline capacity and realize $5/barrel below benchmark prices
Their production costs are $35/BOE when peers achieve $25/BOE
Meanwhile, a company with half the reserves might be a far better investment because:
80% of reserves are PD (producing today with minimal future capex)
They’re underleveraged with strong free cash flow
They own midstream assets and realize premium prices
Their production costs are best-in-class
This is why understanding sector technicals matters. The operational details—assets, infrastructure, costs, capital requirements—determine whether a company creates or destroys value.
The Data Sources - Where To Actually Find This Stuff
If you want to follow the industry seriously, here are your primary sources:
U.S. Energy Information Administration (EIA) (www.eia.gov)
Weekly natural gas storage report (Thursdays, 10:30 AM)
Weekly petroleum status report (Wednesdays, 10:30 AM)
Monthly drilling productivity report
Annual energy outlook (December)
International energy outlook (June)
Short-term energy outlook (monthly, second Tuesday)
Baker Hughes (www.bakerhughesdirect.com)
Weekly rig count (Fridays)
Includes U.S., Canada, and international counts by region and commodity
OPEC (www.opec.org)
Monthly Oil Market Report
Production data and quota decisions
Company Filings
10-K annual reports (full year financials)
10-Q quarterly reports
8-K current reports (material events)
Investor presentations
Industry Publications
Oil & Gas Journal
Petroleum Economist
Natural Gas Intelligence
Most of this data is free. The EIA alone publishes more data than any one person could possibly analyze. Companies are required to disclose detailed financial and operational data in SEC filings.
The problem isn’t access to information. The problem is knowing what information matters and how to interpret it.
How Technicals Reveal Competitive Position
We’ve now covered fundamentals (what’s underground), competitive landscape (who’s positioned to win), and sector technicals (how the system works operationally).
Here’s how they connect:
Fundamentals tell you about resources. Does the company have good reserves? What’s their quality and quantity? How are they getting it?
Competitive Landscape tells you about positioning. Are they in stable countries? Do they have low-cost reserves? Are they integrated or pure-play? Do they have high switching and search cost relative to competitors/ substitutes?
Sector Technicals tell you about execution. Can they actually convert those resources into cash flow? Do they have the right assets and infrastructure? Are they capital efficient?
A company can have great fundamentals (huge reserves) but poor competitive position (high political risk, high costs). Or great fundamentals and good competitive position but terrible technical execution (poor capital allocation, over-leverage, lack of midstream access).
You need all three perspectives to truly understand whether a company is worth owning.
And here’s the beautiful thing about focusing on technicals: They’re measurable, verifiable, and updated constantly. You’re not predicting the future. You’re analyzing the present.
When a company says “we have great reserves,” you can check: What percentage is PD versus PUD? What’s the reserve life? What’s the finding and development cost?
When a company says “we’re capital efficient,” you can check: What’s their reinvestment rate? What’s their free cash flow breakeven? How do their costs compare to peers?
When a company says “we’re well-positioned,” you can check: Do they own midstream infrastructure? What’s their realized price relative to benchmarks? What’s their debt level?
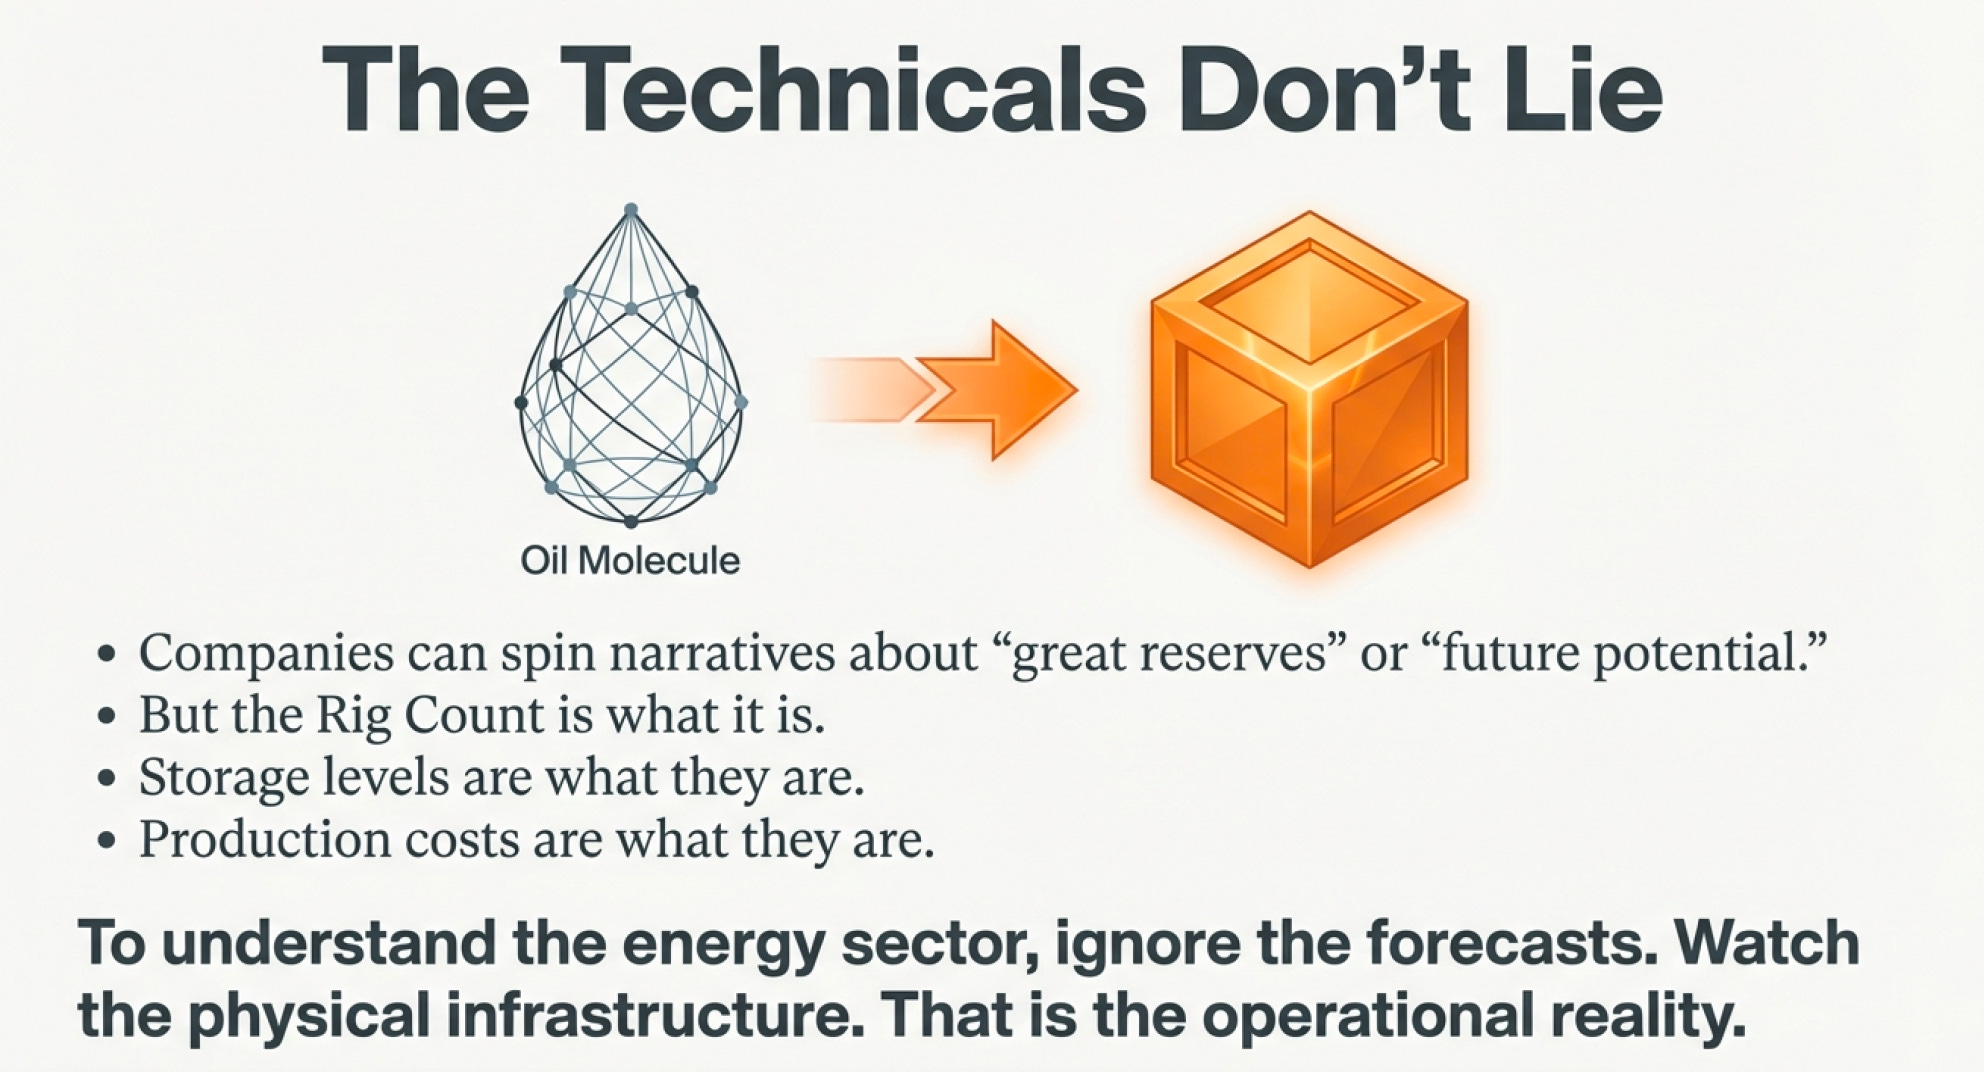
The technicals don’t lie. The rig count is what it is. Storage levels are what they are. Production costs are what they are.
This is why focusing on infrastructure and operational reality beats trying to forecast oil prices or predict economic cycles. You’re analyzing businesses based on what they’re actually doing, not what you hope they might do.
And that’s what makes this approach powerful—and ultimately profitable.
References
Weekly Natural Gas Storage Report timing (released Thursdays at 10:30 AM ET) and definition of working gas in storage — https://ir.eia.gov/ngs/ngs.html
Official EIA explanation of weekly natural gas storage methodology and seasonal comparisons — https://www.eia.gov/naturalgas/storage/
Use of five-year average as benchmark for assessing storage tightness — https://www.eia.gov/naturalgas/storage/basics/
Natural gas storage levels as a driver of short-term price volatility — https://www.investopedia.com/terms/n/natural-gas-storage-indicator-eia-report.asp
Historical examples of natural gas prices reacting sharply to storage surprises — https://www.reuters.com/world/us/us-natural-gas-prices-jump-storage-data-2021-11-18/
Seasonal dependence of U.S. natural gas demand for winter heating — https://www.eia.gov/energyexplained/natural-gas/use-of-natural-gas.php
Henry Hub natural gas price benchmark definition — https://www.eia.gov/dnav/ng/ng_pri_fut_s1_d.htm
Explanation of forward contracts and hedging in energy markets — https://www.investopedia.com/terms/f/forwardcontract.asp
Role of under-hedging in utility and producer financial risk — https://www.naturalgasintel.com/hedging-mistakes-have-cost-utilities-billions/
Overview of upstream, midstream, and downstream oil and gas sectors — https://www.eia.gov/energyexplained/oil-and-petroleum-products/oil-and-the-economy.php
Geological age and formation of Permian Basin hydrocarbons — https://www.usgs.gov/programs/energy-resources-program/permian-basin
Average shale well drilling and completion costs ($7–10 million range) — https://www.eia.gov/todayinenergy/detail.php?id=59360
Hydraulic fracturing process explanation — https://www.energy.gov/eere/femp/hydraulic-fracturing
Shale well decline curves showing 50–70% first-year decline — https://jpt.spe.org/understanding-decline-curve-analysis
Capital intensity of shale drilling required to offset declines — https://www.eia.gov/todayinenergy/detail.php?id=46576
Definitions of operating cash flow, capital expenditures, and free cash flow — https://www.investopedia.com/terms/f/freecashflow.asp
Importance of reinvestment rate in upstream oil and gas economics — https://www.mckinsey.com/industries/oil-and-gas/our-insights/capital-discipline-in-upstream-oil-and-gas
Comparison of conventional versus shale reinvestment requirements — https://www.rystadenergy.com/news/shale-capital-efficiency
Proved Developed (PD), PDNP, and Proved Undeveloped (PUD) reserve definitions — https://www.sec.gov/spotlight/oilandgas.shtml
SEC reserve classification standards and economic test requirements — https://www.sec.gov/rules/final/2008/33-8995.pdf
Impact of 2014–2015 oil price collapse on upstream companies — https://www.reuters.com/article/us-oil-price-collapse-analysis-idUSKBN0KJ1QW
Explanation of why PD reserves remain economic at lower oil prices — https://www.investopedia.com/terms/p/proved-reserves.asp
Midstream gathering, processing, transmission, and storage functions — https://www.eia.gov/energyexplained/natural-gas/midstream.php
LNG export terminal process and liquefaction temperatures (-162°C) — https://www.eia.gov/energyexplained/natural-gas/liquefied-natural-gas.php
Fee-based midstream business model explanation — https://www.investopedia.com/terms/m/master-limited-partnership.asp
Take-or-pay contract structure explanation — https://www.investopedia.com/terms/t/take-or-pay.asp
Kinder Morgan pipeline mileage and U.S. gas market share — https://www.kindermorgan.com/About_Us/Company_Overview
Fixed-cost nature of pipeline infrastructure and capacity utilization risk — https://www.eia.gov/todayinenergy/detail.php?id=40272
Permian Basin pipeline bottlenecks causing Midland crude discounts — https://www.reuters.com/article/us-usa-oil-permian-pipelines-idUSKCN1G42M2
Historical $10–$15/bbl WTI Midland discount due to takeaway constraints — https://rbnenergy.com/permian-bottlenecks-and-price-discounts
Resolution of Permian bottlenecks via new pipelines (Cactus II, Gray Oak, EPIC) — https://www.eia.gov/todayinenergy/detail.php?id=43095
Refining process overview and refinery product slate — https://www.eia.gov/energyexplained/oil-and-petroleum-products/refining-crude-oil.php
ExxonMobil Baytown refinery capacity and scale — https://corporate.exxonmobil.com/locations/united-states/texas/baytown
Definition and purpose of crack spreads — https://www.cmegroup.com/education/articles-and-reports/understanding-the-crack-spread.html
Long-term decline in refining margins — https://www.reuters.com/business/energy/global-refining-margins-pressure-2024-10-09/
Overcapacity and commodity nature of refining business — https://www.iea.org/reports/oil-2023
Environmental regulation costs impacting refining economics — https://www.epa.gov/stationary-sources-air-pollution/oil-and-gas-sector
Phillips 66 refinery footprint and export strategy — https://investor.phillips66.com/overview/default.aspx
Baker Hughes rig count definition and weekly publication —https://rigcount.bakerhughes.com/
Relationship between rig count and future production trends — https://www.eia.gov/todayinenergy/detail.php?id=59020
Improvements in drilling efficiency and rig productivity since 2010 — https://www.eia.gov/petroleum/drilling/
U.S. crude oil production near record highs (~13 million bpd) — https://www.eia.gov/dnav/pet/pet_crd_crpdn_adc_mbblpd_a.htm
Importance of Cushing, Oklahoma as WTI delivery hub — https://www.cmegroup.com/education/articles-and-reports/cushing-oklahoma.html
2020 negative oil price event caused by storage constraints — https://www.reuters.com/article/us-global-oil-prices-negative-idUSKBN2220Q9
Drilling Productivity Report explaining shale production trends — https://www.eia.gov/petroleum/drilling/
Petroleum Supply Monthly explanation — https://www.eia.gov/petroleum/supplymonthly/
Natural Gas Monthly data explanation — https://www.eia.gov/naturalgas/monthly/
OPEC share of global oil production and quota system — https://www.opec.org/opec_web/en/data_graphs/330.htm
OPEC compliance tracking using secondary sources — https://www.reuters.com/markets/commodities/opec-compliance-oil-cuts-2024-08-15/
Lifting of U.S. crude oil export ban in 2015 — https://www.congress.gov/bill/114th-congress/house-bill/2029
Growth of U.S. crude oil exports post-2015 — https://www.eia.gov/todayinenergy/detail.php?id=41833