
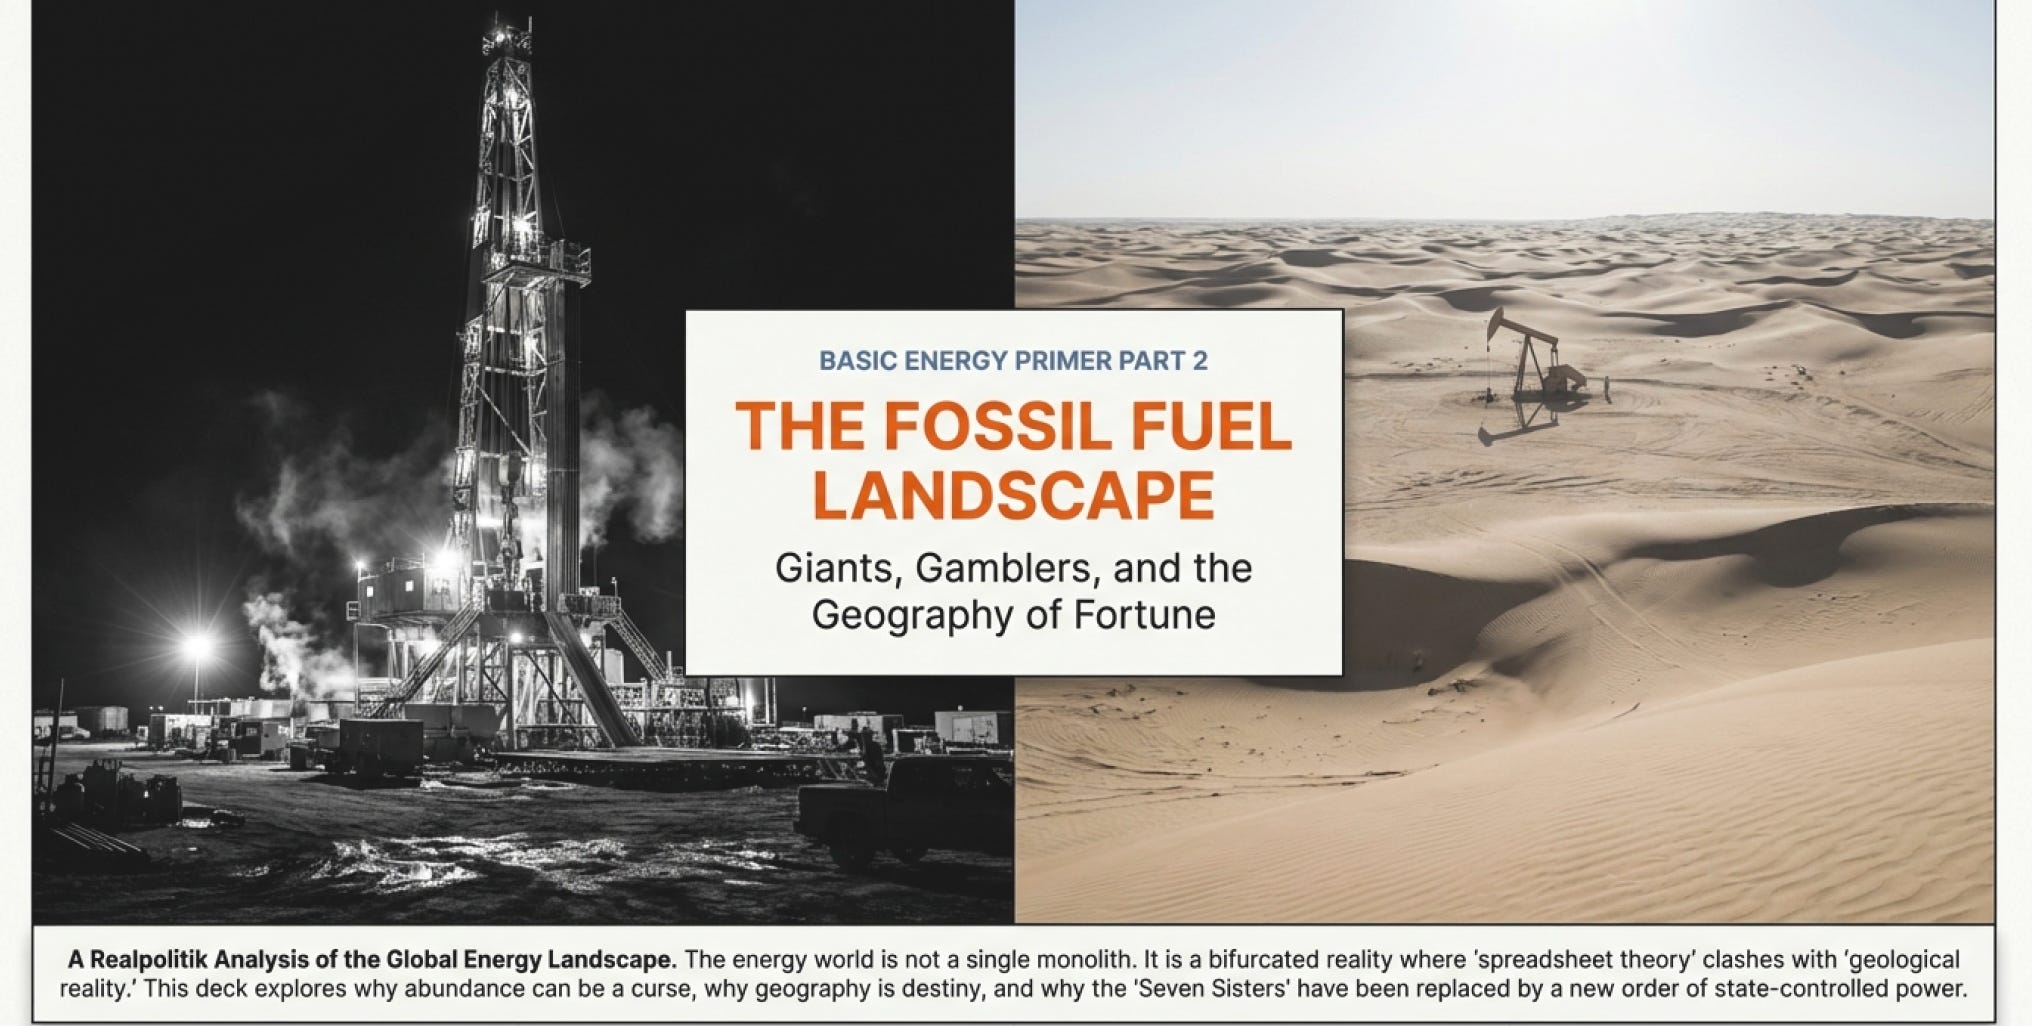
🛢️Basic Energy Primer Part 2 - Business and Competitive Landscape
The Fossil Fuel Business & Competitive Landscape: A Story of Giants, Gamblers, and the Geography of Fortune

The Man Who Bet Everything on Being Wrong
On October 2007 Mark Papa, CEO of EOG Resources, stands before his executive team with news that would sound clinically insane to anyone in the room. The company had just doubled its net income. Natural gas prices were fresh off all-time highs. New drilling technologies were opening vast gas fields across America like treasure chests—Barnett Shale in Texas was gushing. EOG’s core business was absolutely printing money.
And Papa wanted to stop.
“We had probably ruined the market for 20 years,” he declared flatly.
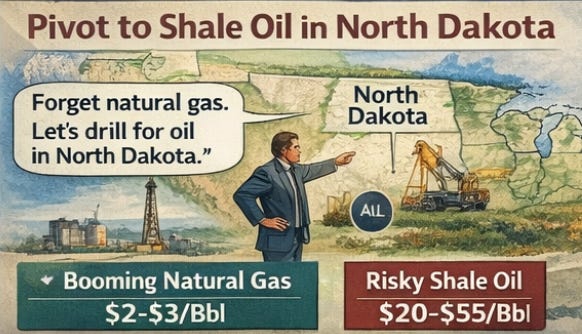
Now, imagine being in that room. Your CEO just told you that your company is too successful and therefore must completely pivot to a different business—one where you have almost no track record. Papa wanted EOG to shift entirely toward oil. Not in Canada. Not in Africa. Not in the deep waters of the Gulf of Mexico where everyone with an MBA and a PowerPoint deck insisted the future lay. No—Papa wanted to drill for oil in North Dakota, where wildcatters had been pumping modest amounts of crude for decades but nobody had ever found a real gusher.
His team must have exchanged those awkward glances people make when they’re wondering if the boss has finally cracked
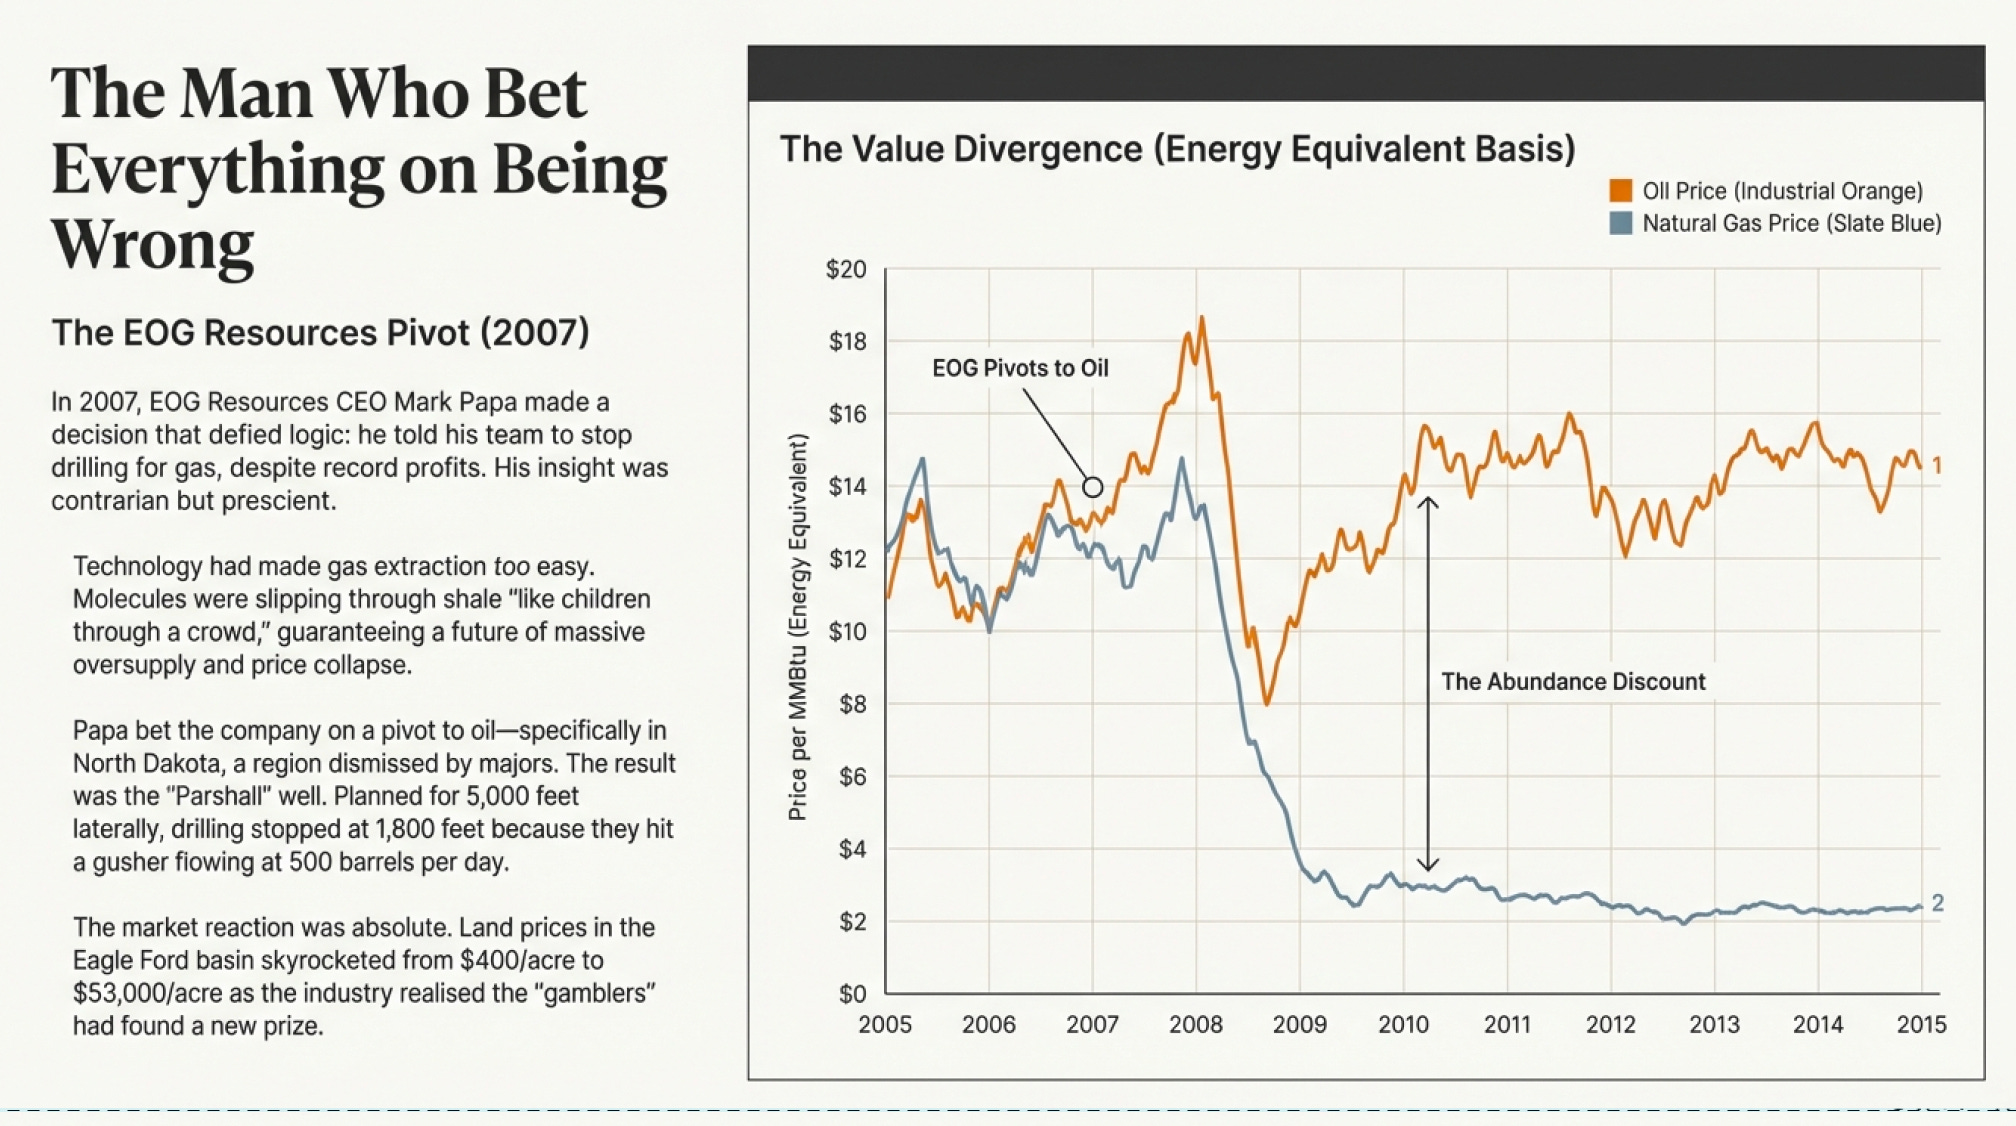
Here’s what Papa saw that almost nobody else did: The industry had become too good at finding natural gas. The very technology making EOG successful—combining horizontal drilling with hydraulic fracturing—was unlocking so much gas that the market would be oversupplied for decades. Gas molecules are small. They slip through tiny pores in shale rock like children through a crowd. Conventional wisdom said oil molecules were too big—they’d never flow through shale the same way.
Papa bet his company that conventional wisdom was wrong.
Six months later, at a tiny outpost called Parshall about 50 miles west of Minot, North Dakota, EOG drilled its first major test. Executive VP Kurt Doerr watched as his crew drilled down 9,100 feet, then curved out laterally like a hockey stick to target a 40-foot-wide layer of porous, oily rock sandwiched between thick layers of shale. Their goal was to drill horizontally for 5,000 feet.
They only made it 1,800 feet.
Not because something broke. Because they hit so much oil and gas they had to stop drilling and start producing immediately.
The well produced 450 to 500 barrels per day. Five times Doerr’s best-case scenario. While the rest of the industry obsessed over natural gas, Papa had quietly positioned EOG to dominate what would become the shale oil revolution. By 2010, EOG discovered the Eagle Ford Shale in Texas—a play that would eventually produce over 285 million barrels of oil. Land prices in the Eagle Ford shot from EOG’s initial $400 per acre to $53,000 as competitors realized what was happening and stampeded in.
By 2014, EOG had become the largest onshore crude oil producer in the United States. Analysts nicknamed them “the Apple of oil” for their innovative culture.
But here’s what matters: This wasn’t just an American game changer. It was a global game changer. And to understand why, we need to talk about something that sounds boring but explains everything about this industry.
We need to talk about geography.
Why Your Zip Code Beats Your Business Plan
Mining—and oil extraction is mining, just for liquids—is fundamentally a waste production business. Think about what you’re actually doing: You’re moving enormous amounts of rock that contains tiny amounts of what you want. A deposit with a higher grade of what you’re seeking means less waste rock, less energy, and a smaller environmental footprint.
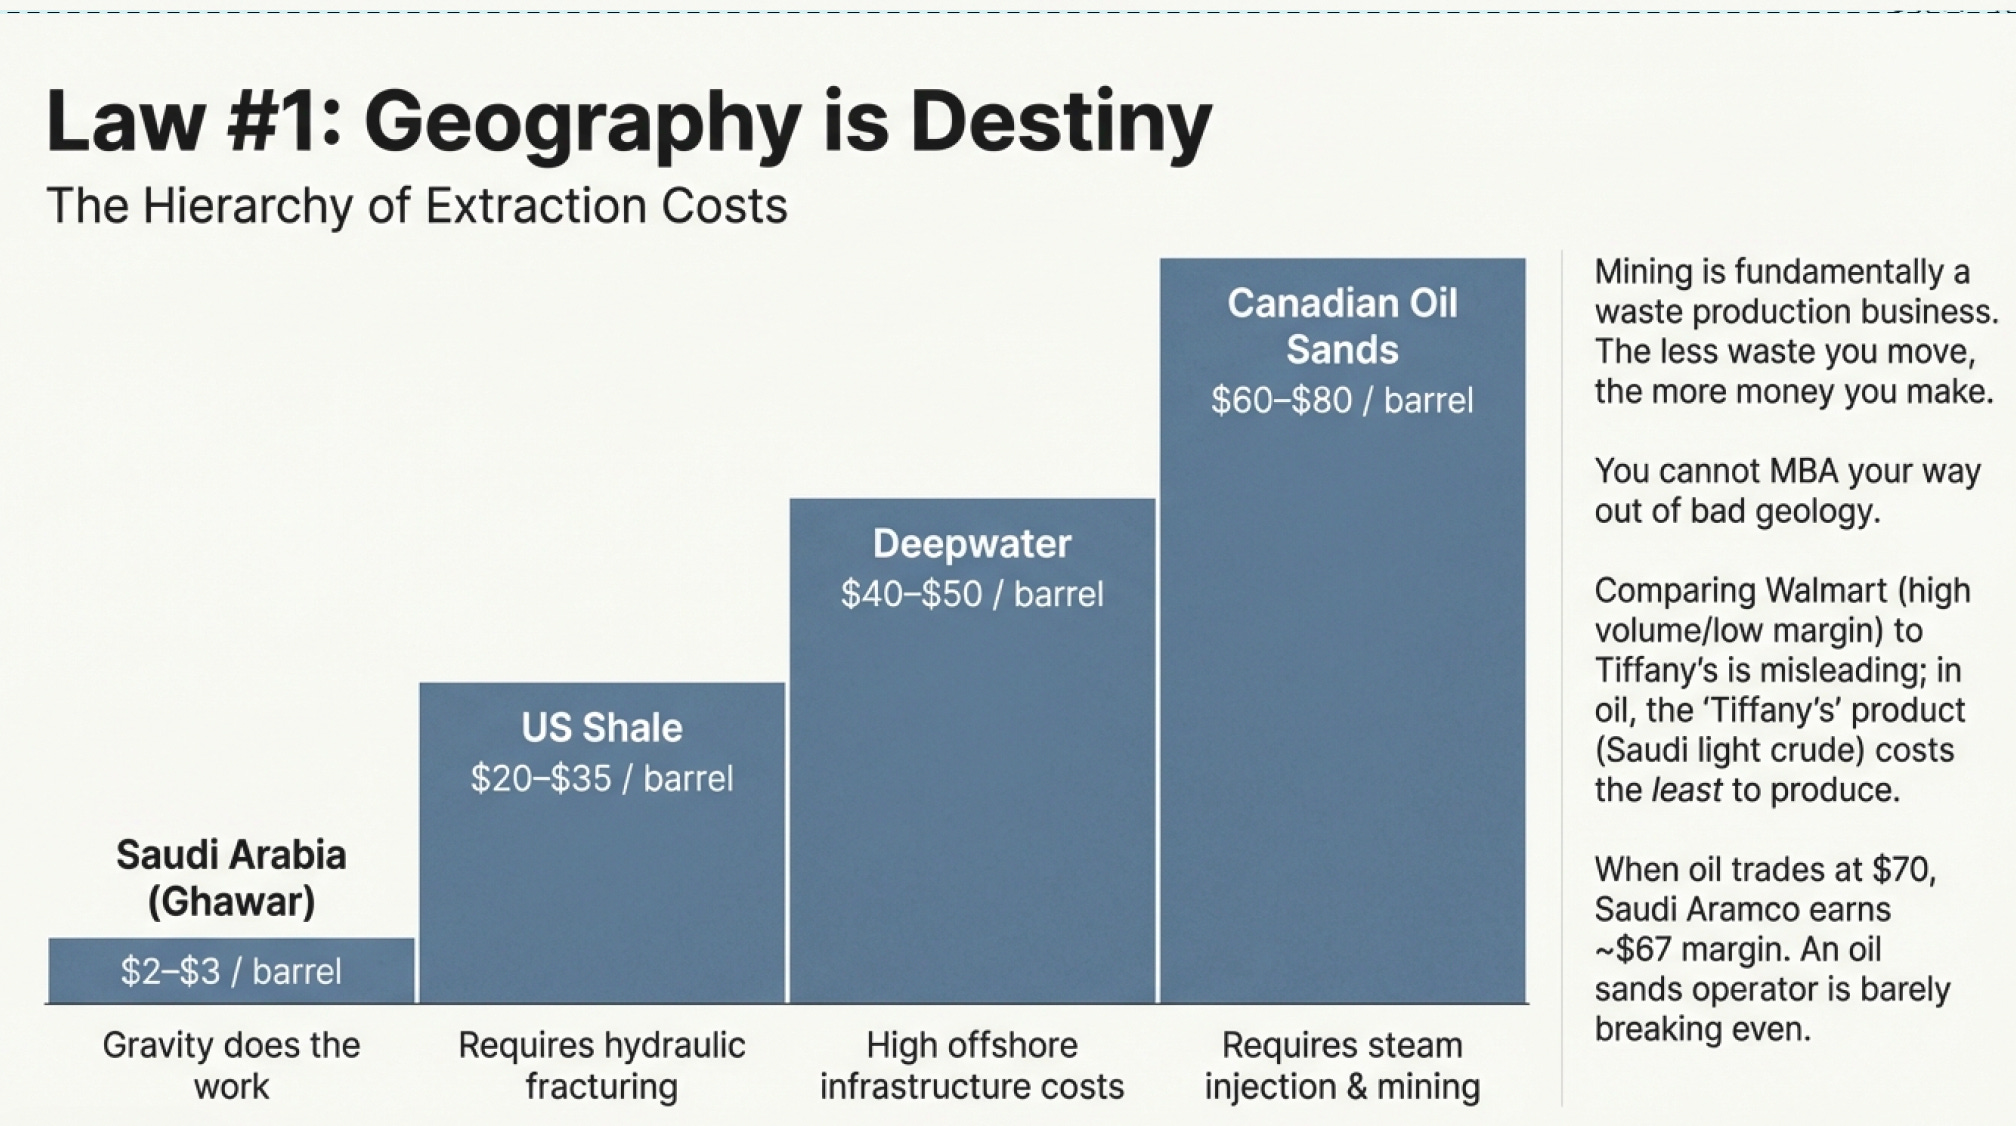
Now here’s where it gets interesting. This principle scales dramatically in oil and gas in ways that would make any reasonable person nod knowingly.
Consider Saudi Arabia’s Ghawar field, the largest conventional oil field in the world. The lifting costs—meaning the cost to extract one barrel of oil once you’ve already built the infrastructure—are estimated at $2 to $3 per barrel. Now compare that to U.S. shale operators, where lifting costs typically run $20 to $35 per barrel depending on the field. Deepwater Gulf of Mexico? $40 to $50 per barrel. Canadian oil sands? $60 to $80 per barrel.
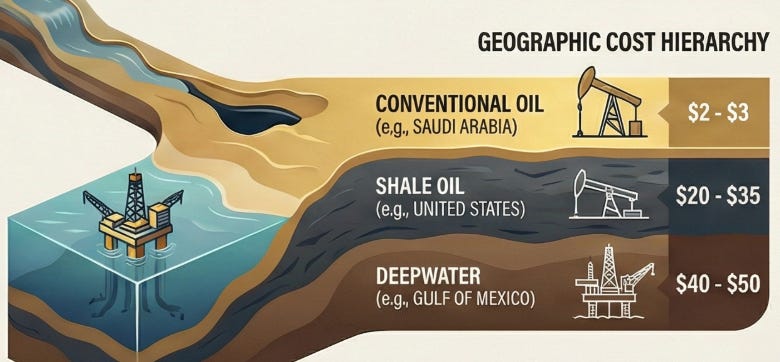
When oil trades at $70 per barrel, Saudi Aramco earns roughly $67 to $68 per barrel in gross margin before taxes and royalties. An efficient U.S. shale operator might earn $35 to $50. A Canadian oil sands operator is barely profitable.
These aren’t small differences. They’re different businesses wearing the same industry label. It’s like saying both Walmart and Tiffany’s are “retailers”—technically true, completely misleading.
And here’s the kicker: No amount of brilliant management can overcome bad geology. You can’t MBA your way out of extracting oil from tar sands when your competitor is pumping light sweet crude from 5,000 feet underground in the desert with gravity doing half the work.
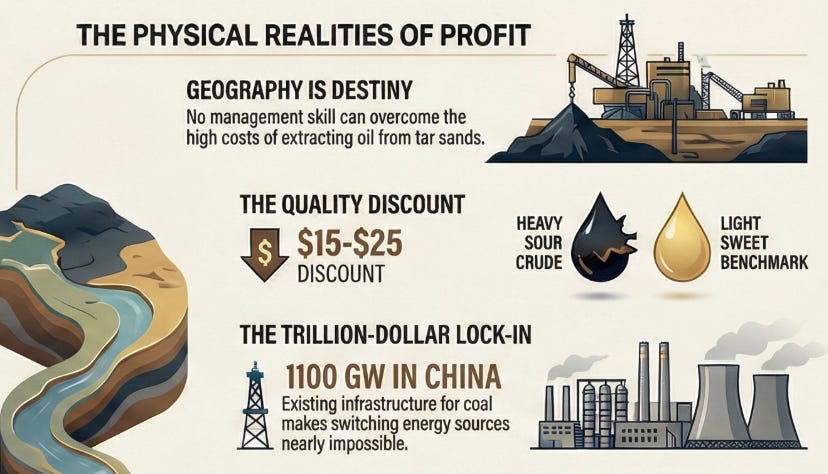
Geography is destiny.
But there’s a plot twist that makes this story far more interesting than simple geology.
The Coup That Nobody Noticed
For most of the 20th century, global oil was controlled by a powerful cartel known as the “Seven Sisters”: Standard Oil of New Jersey (Exxon), Standard Oil of New York (Mobil), Standard Oil of California (Chevron), Gulf Oil, Texaco, Royal Dutch Shell, and Anglo-Persian Oil Company (BP). This group dominated production, pricing, and access to reserves from the Middle East to Latin America. They shaped markets, dictated terms to host countries, and built the foundations of the modern energy system
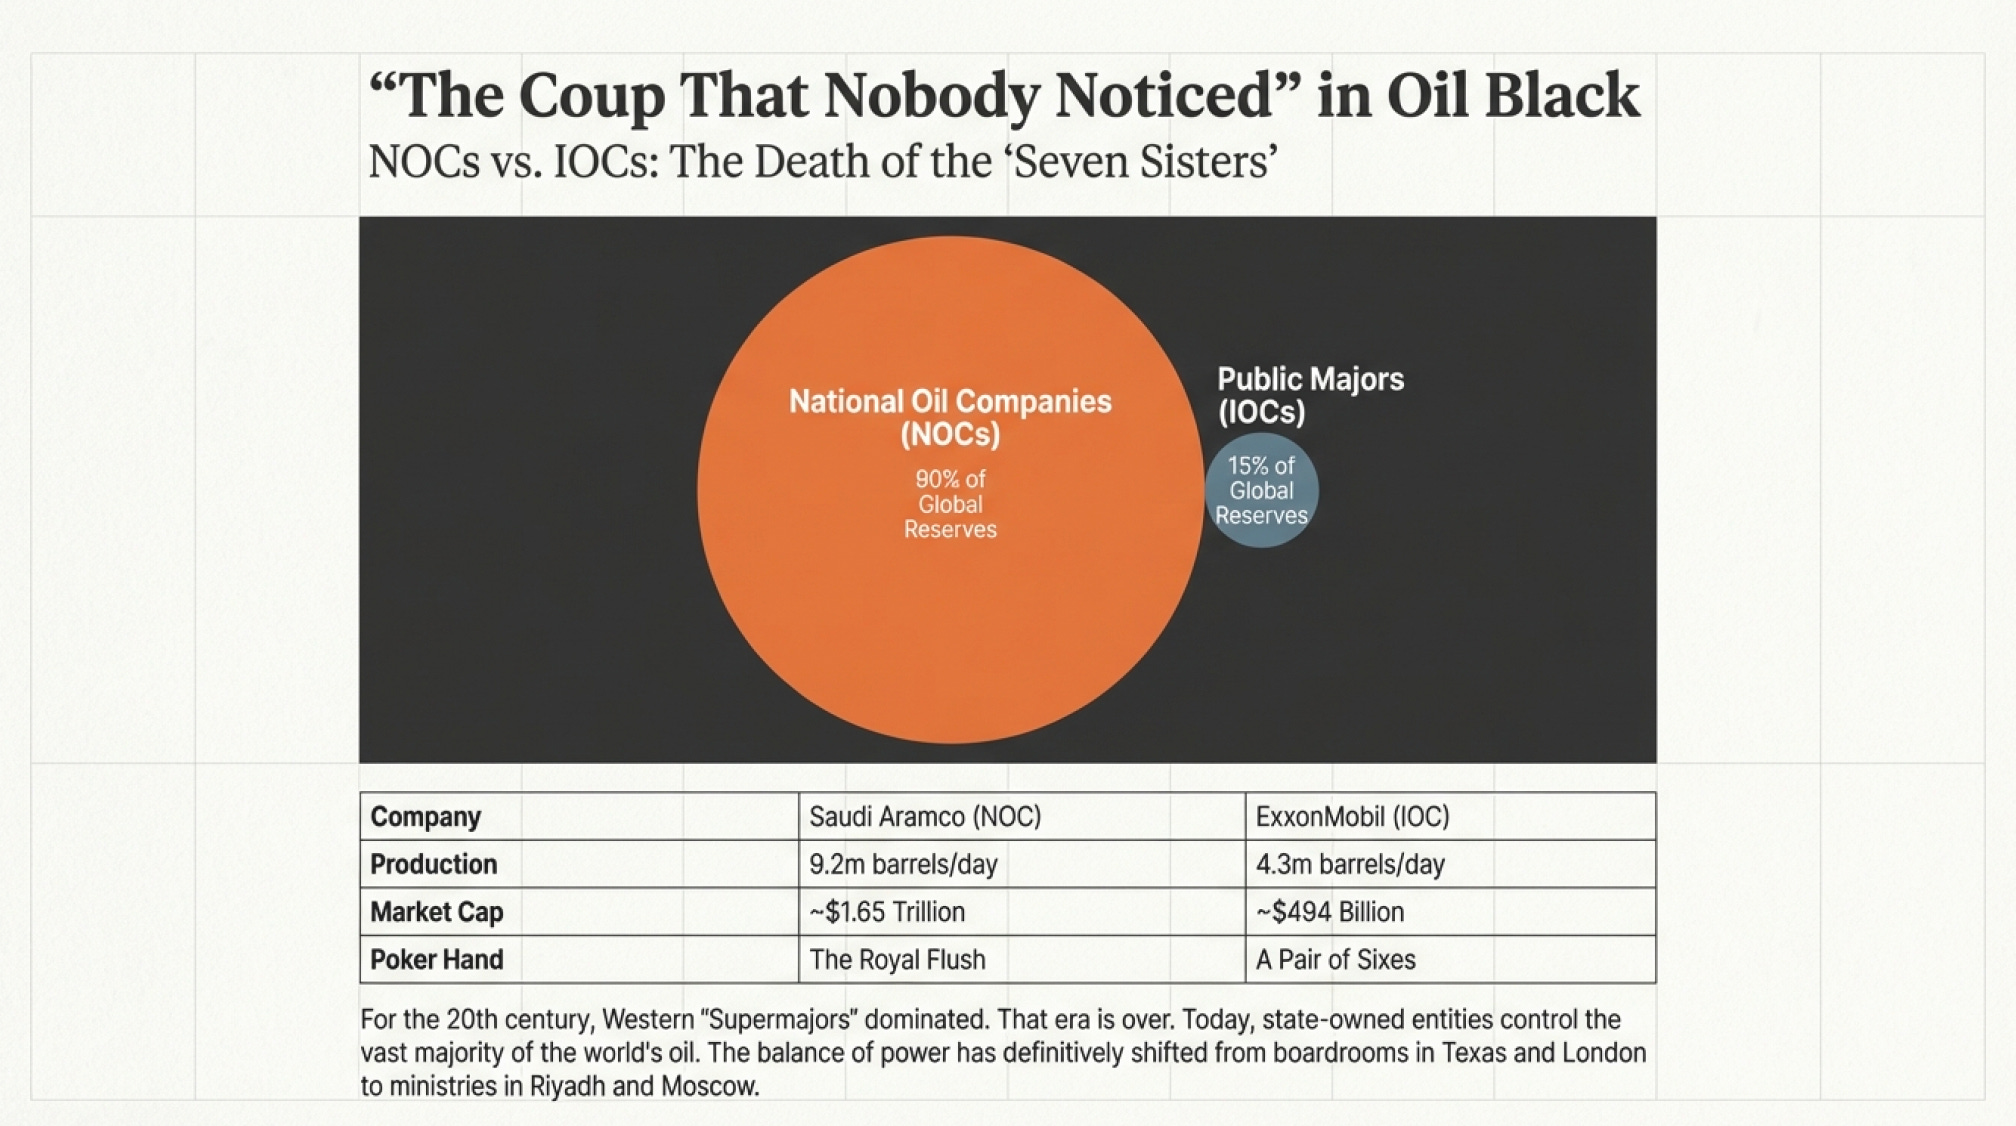
That world is dead, and most people haven’t noticed the corpse.
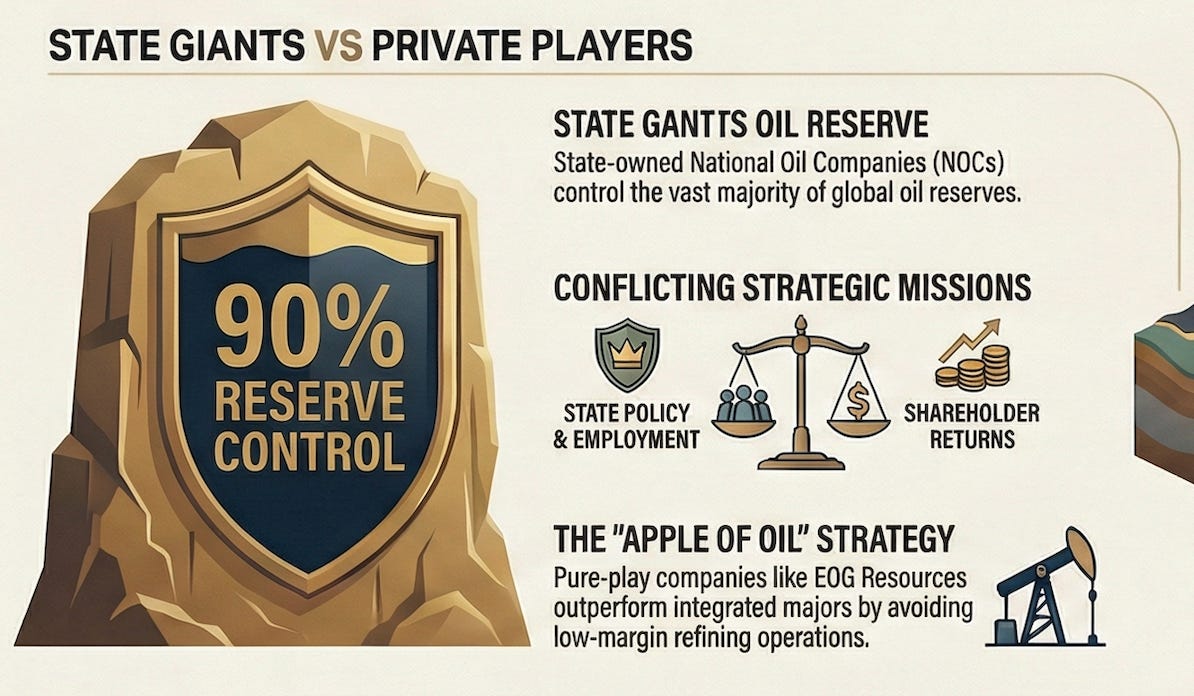
Today, National Oil Companies (NOCs)—state-owned giants like Saudi Aramco, Abu Dhabi National Oil Company (ADNOC), and Petrobras—control roughly 90% of global oil reserves and over half of daily production. Publicly listed energy companies like ExxonMobil and Shell control just 15% of the world’s known reserves.
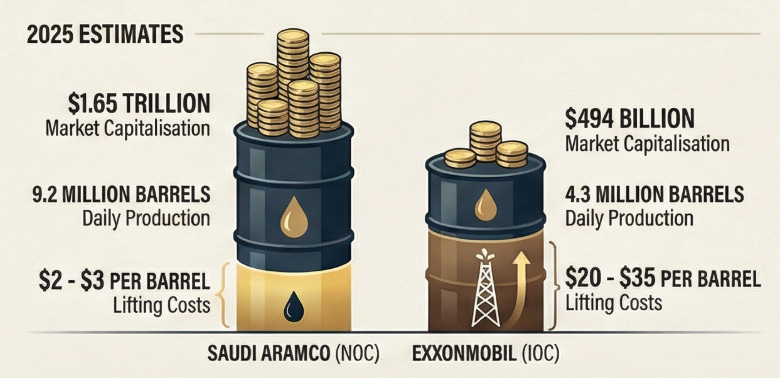
Let me put that in perspective. As of December 2025, Saudi Aramco leads the world with a market capitalization of approximately $1.65 trillion, producing about 9.2 million barrels per day. ExxonMobil, the second most valuable oil and gas company globally, has a market cap of $494 billion and produces about 4.3 million barrels of oil equivalent per day.
Aramco produces more than twice as much oil as ExxonMobil. The market values it at more than three times Exxon’s value. And remember those lifting costs? Aramco’s $2-3 per barrel versus Exxon’s $20-35 per barrel in most of their operations.
If this were a poker game, Aramco is sitting there with a royal flush, and ExxonMobil is trying to make something work with a pair of sixes
But here’s where the story gets really interesting, in a way that reveals something profound about how this industry actually works.
Why Profit Isn’t Always the Point
National Oil Companies aren’t trying to maximize shareholder returns the way ExxonMobil or Chevron must. They can’t. They’re instruments of state policy, and that changes everything.
Take Nigeria’s Nigerian Content Development and Monitoring Board, established in 2010. It mandates that oil projects allocate at least 70% of expenditures to local firms. By 2023, indigenous engineering services provision had increased dramatically, with over $10 billion in in-country spending.
Now, if you’re a bean counter trained at Harvard Business School, this looks like economic suicide. You’re mandating that companies hire less efficient local firms instead of the best global contractors. An International Oil Company (IOC) making these decisions voluntarily would face a shareholder revolt
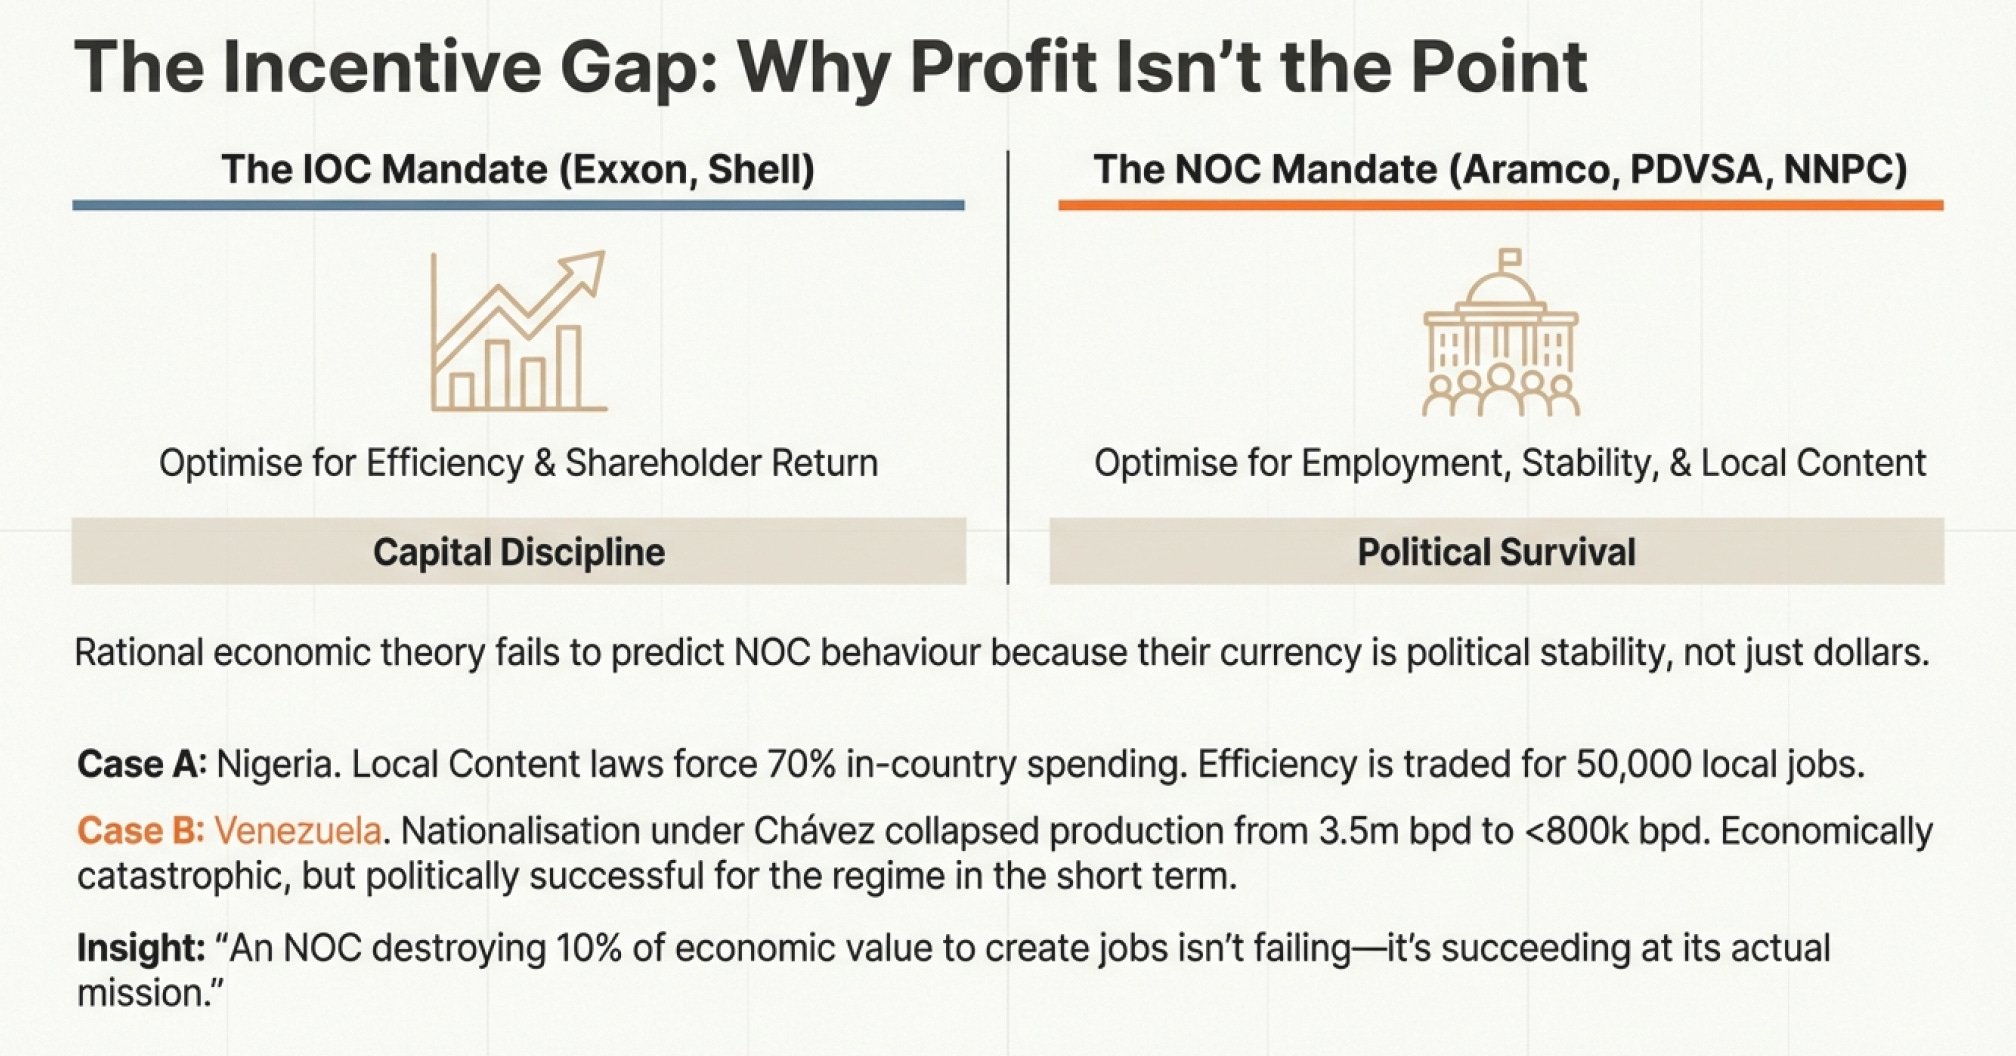
But if you’re the Nigerian government, this is literally your job. You’re trading some economic efficiency for employment, technology transfer, and political stability. An NOC destroying 10% of economic value to create 50,000 jobs in politically sensitive regions isn’t failing—it’s succeeding at its actual mission.
Or consider Venezuela’s PDVSA under Hugo Chávez. He hiked royalties to 33% by 2007 and nationalized projects, seizing assets from foreign oil companies at low prices and forcing them out. Production collapsed from 3.5 million barrels per day in 1998 to under 800,000 by 2023, despite Venezuela having some of the world’s largest proven reserves.
From a shareholder value perspective? Catastrophic. Venezuela basically turned the Saudi Arabia of South America into an oil pauper through mismanagement and politics.
From Chávez’s political perspective? Nationalizing oil was central to his brand and power base, even though it destroyed the industry’s productive capacity. He won elections. The oil industry imploded. Both things can be true.
This creates a fascinating dynamic that shapes everything about the competitive landscape. NOCs control the reserves. IOCs have the technology, management expertise, and capital. Neither can fully succeed without the other, but the terms of engagement have completely flipped since the Seven Sisters era.
The Marriage of Necessity (Where Nobody’s Really Happy)
Today, when NOCs want to develop their assets, they make various types of contracts with IOCs:
Concession Agreements: The government gives a company the right to operate in a specific area for a specific timeframe.
Production Sharing Agreements: The most common structure. The foreign oil company gets a percentage of production revenue (typically 15-40%) in exchange for capital investments. These usually last 25-40 years.
Joint Ventures: Companies combine resources for a project, particularly when a country lacks specific technology. For example, Rosneft and ExxonMobil partnered to develop tight oil projects in western Siberia so Russia could utilize ExxonMobil’s drilling and completion technology.
Technical Service Agreements: The NOC contracts an outside oil company for a specific service and pays them a fixed fee per barrel—essentially turning the IOC into a well-paid contractor with no equity stake in the reserves.
The balance of power is stark and utterly different from 50 years ago. In 2007, when Venezuela nationalized its oil and gas assets, foreign companies like ExxonMobil had no choice but to accept low prices for their investments or abandon them entirely. They left.
When a country that controls 90% of global reserves says “these are the terms,” IOCs can either accept them or walk away from some of the world’s cheapest and most productive reserves.
And this brings us back to Papa’s gamble in 2007, because now we can see it in a different light.
How Property Law Created an Energy Revolution
The United States represents a fascinating anomaly in this NOC-dominated world, and the anomaly has nothing to do with technology or management or capital markets.
It’s about property law.
Unlike virtually every other major oil-producing nation, the U.S. maintains a legal framework where individuals and companies can own mineral rights beneath their property. In Saudi Arabia, all oil belongs to the state. In Russia, all oil belongs to the state. In Mexico, all oil belongs to the state. In Norway, Venezuela, Iran, Iraq—all state ownership.
This seemingly arcane legal difference created the conditions for the shale revolution
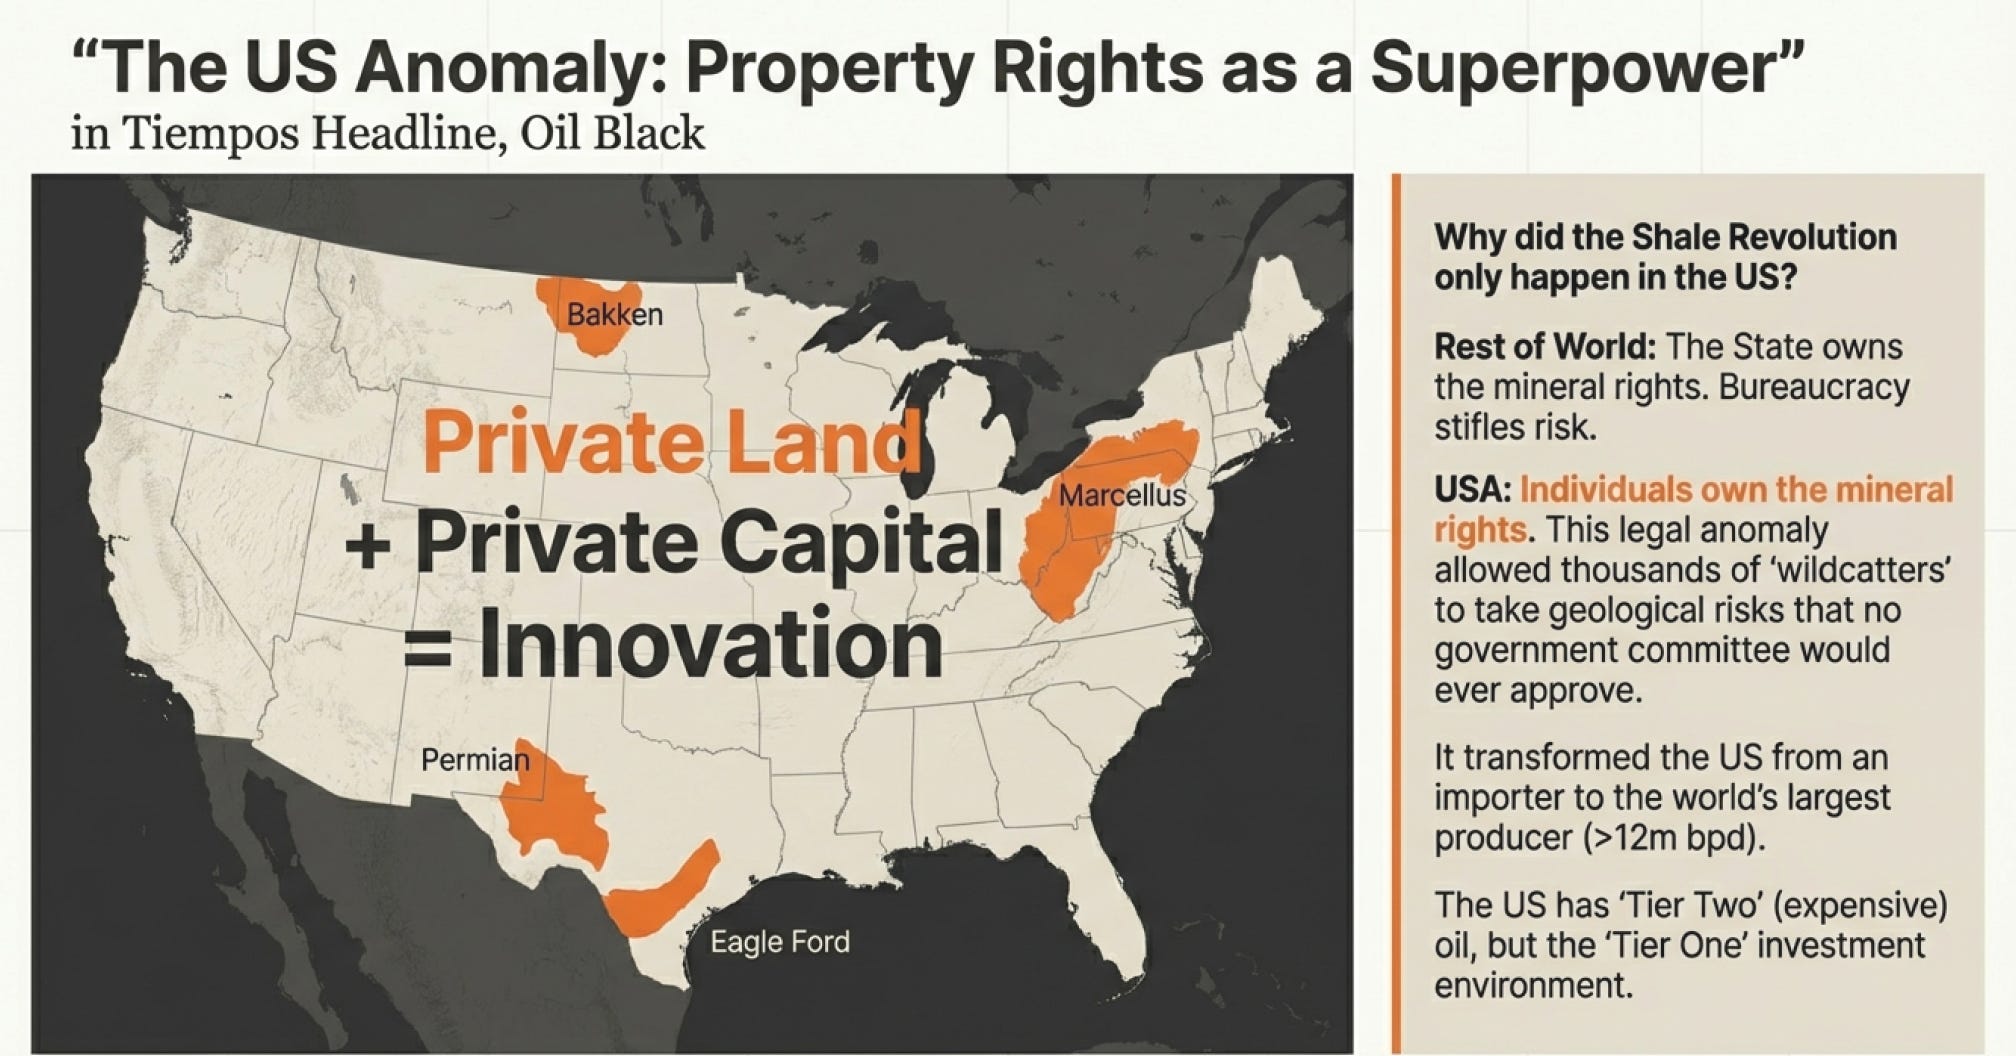
Think about it: If all U.S. mineral rights belonged to the federal government, could thousands of small exploration and production companies have drilled experimental wells across Texas, North Dakota, Oklahoma, and Pennsylvania? Would bureaucrats have approved EOG’s risky pivot from gas to oil in 2007? Would entrepreneurial wildcatters have been able to lease land directly from farmers and ranchers, creating the land rush that spread shale technology across the country?
Almost certainly not. The shale revolution happened because thousands of companies could make independent bets with private capital on privately-owned or state-owned lands with competitive leasing processes. By 2014, this decentralized system transformed the U.S. from an oil importer into the world’s largest producer, averaging over 12 million barrels per day by the early 2020s.
Here’s what’s fascinating: The U.S. produces the world’s most expensive oil (on a lifting cost basis), but it might be some of the most economically rational oil to invest in because the rules don’t change overnight.
This created a two-tiered global industry with a delicious irony:
Tier One: NOC-dominated regions with the world’s cheapest, most abundant reserves but constrained by state priorities, political interference, and the need to balance revenue maximization with employment, local content requirements, and political objectives. The oil is cheap, but the business is complicated.
Tier Two: U.S. shale and other IOC-operated regions with more expensive production but greater operational flexibility, technological innovation, and management that must deliver returns or go bankrupt. The oil is expensive, but the business is straightforward.
If you’re an investor, which would you rather own? The cheaper oil in a place where the government might change the rules tomorrow? Or the more expensive oil in a place with property rights and the rule of law?
This is the essential question, and different people answer it differently. But understanding that the question exists is crucial.
Why Being “Integrated” Often Means “Mediocre”
Now we need to talk about why some of the most famous names in oil are actually mediocre businesses dressed up in impressive balance sheets.
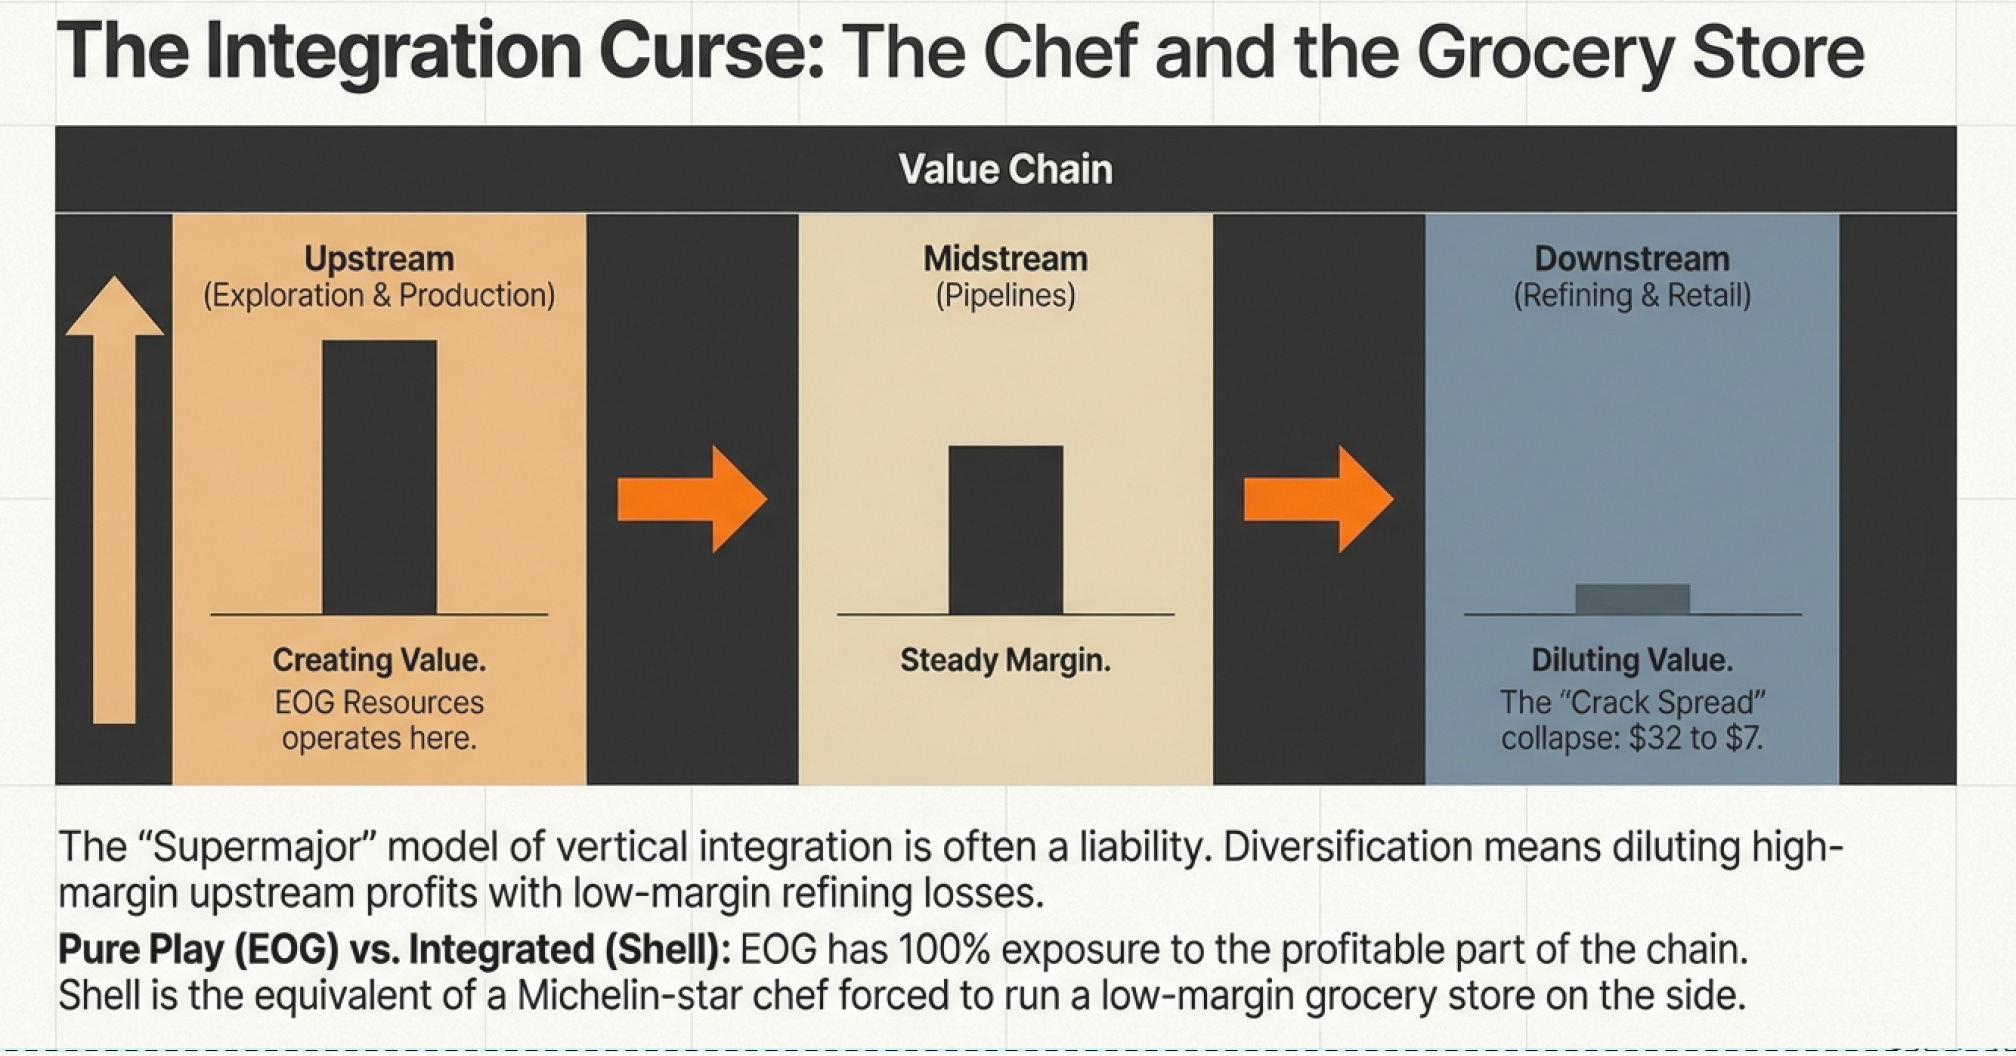
To produce gasoline from crude oil, the oil molecules first need to be “cracked” in devices like hydrocrackers or fluid catalytic crackers. The profit margin refiners make is called the “crack spread.” In December 1998, crack spreads hit $31.98 per barrel. By the 2020s, they’d collapsed to around $7 per barrel—a loss of more than 70%.
Think about what this means for integrated oil companies.
If you’re Shell, with operations spanning the entire value chain from exploration to gas stations, you have:
Upstream operations (exploring and producing oil and gas) - high margin when oil prices are strong
Midstream operations (pipelines, storage, LNG facilities) - steady, boring cash flow
Downstream operations (refining and retail) - terrible margins
The upstream business is profitable when oil prices are strong, but you have limited access to the cheapest reserves (controlled by NOCs). The downstream refining business operates on razor-thin margins. The midstream business is fine but not exciting.
The result? Your aggregate returns are diluted by the low-margin refining business, even if your upstream operations are performing well. You’re the investment equivalent of a really talented chef who’s required to also run a low-margin grocery store. Sure, you’re “diversified,” but is that actually helping?
Compare this to EOG Resources: pure upstream, focused on the lowest-cost, highest-return shale assets. They don’t own refineries. They don’t run gas stations. They find oil and gas, extract it efficiently, and sell it. When they do this well, 100% of their business benefits from strong commodity prices. When oil prices fall, 100% of their business suffers. But they’re not dragging around a refining business earning 3% margins when their exploration business could earn 40% margins.
As of December 2025, Chevron’s market cap is $279 billion. EOG Resources has delivered superior returns to shareholders over most time periods despite being a fraction of Chevron’s size, precisely because they’re not carrying around low-margin refining operations.
Organizations tend to do what they’ve always done even when it stops making sense. Shell and BP built refineries a century ago when it made strategic sense. Now they keep them because... well, they’ve always had refineries.
Meanwhile, the pure-play upstream companies print money.
The Natural Gas Paradox - Why Abundance Can Be a Curse
Natural gas presents perhaps the strangest paradox in energy markets, and it takes us back to where we started with Papa’s insight in 2007.
Natural gas is clean-burning, cheaper than oil, and low-carbon compared to coal. By late 2019, natural gas had risen to 38% of U.S. electricity generation, while coal had fallen to 24%. This shift was the main reason U.S. CO2 emissions dropped to early 1990s levels despite the economy doubling in size.
But here’s natural gas’s fundamental weakness: It’s abundant. Perhaps too abundant.
Remember Papa saying “we had probably ruined the market for 20 years”? He was right. As of late 2025, U.S. natural gas prices often trade in the $2-3 per MMBtu range, occasionally spiking to $5-7 during extreme weather events, but rarely sustaining prices above $4 for long.
Compare this to oil, which trades around $70-80 per barrel (roughly $12-14 per MMBtu on an energy-equivalent basis). On an energy-equivalent basis, oil trades at 4-6 times the price of natural gas.
Why such a massive gap for fuels that can often serve similar purposes?
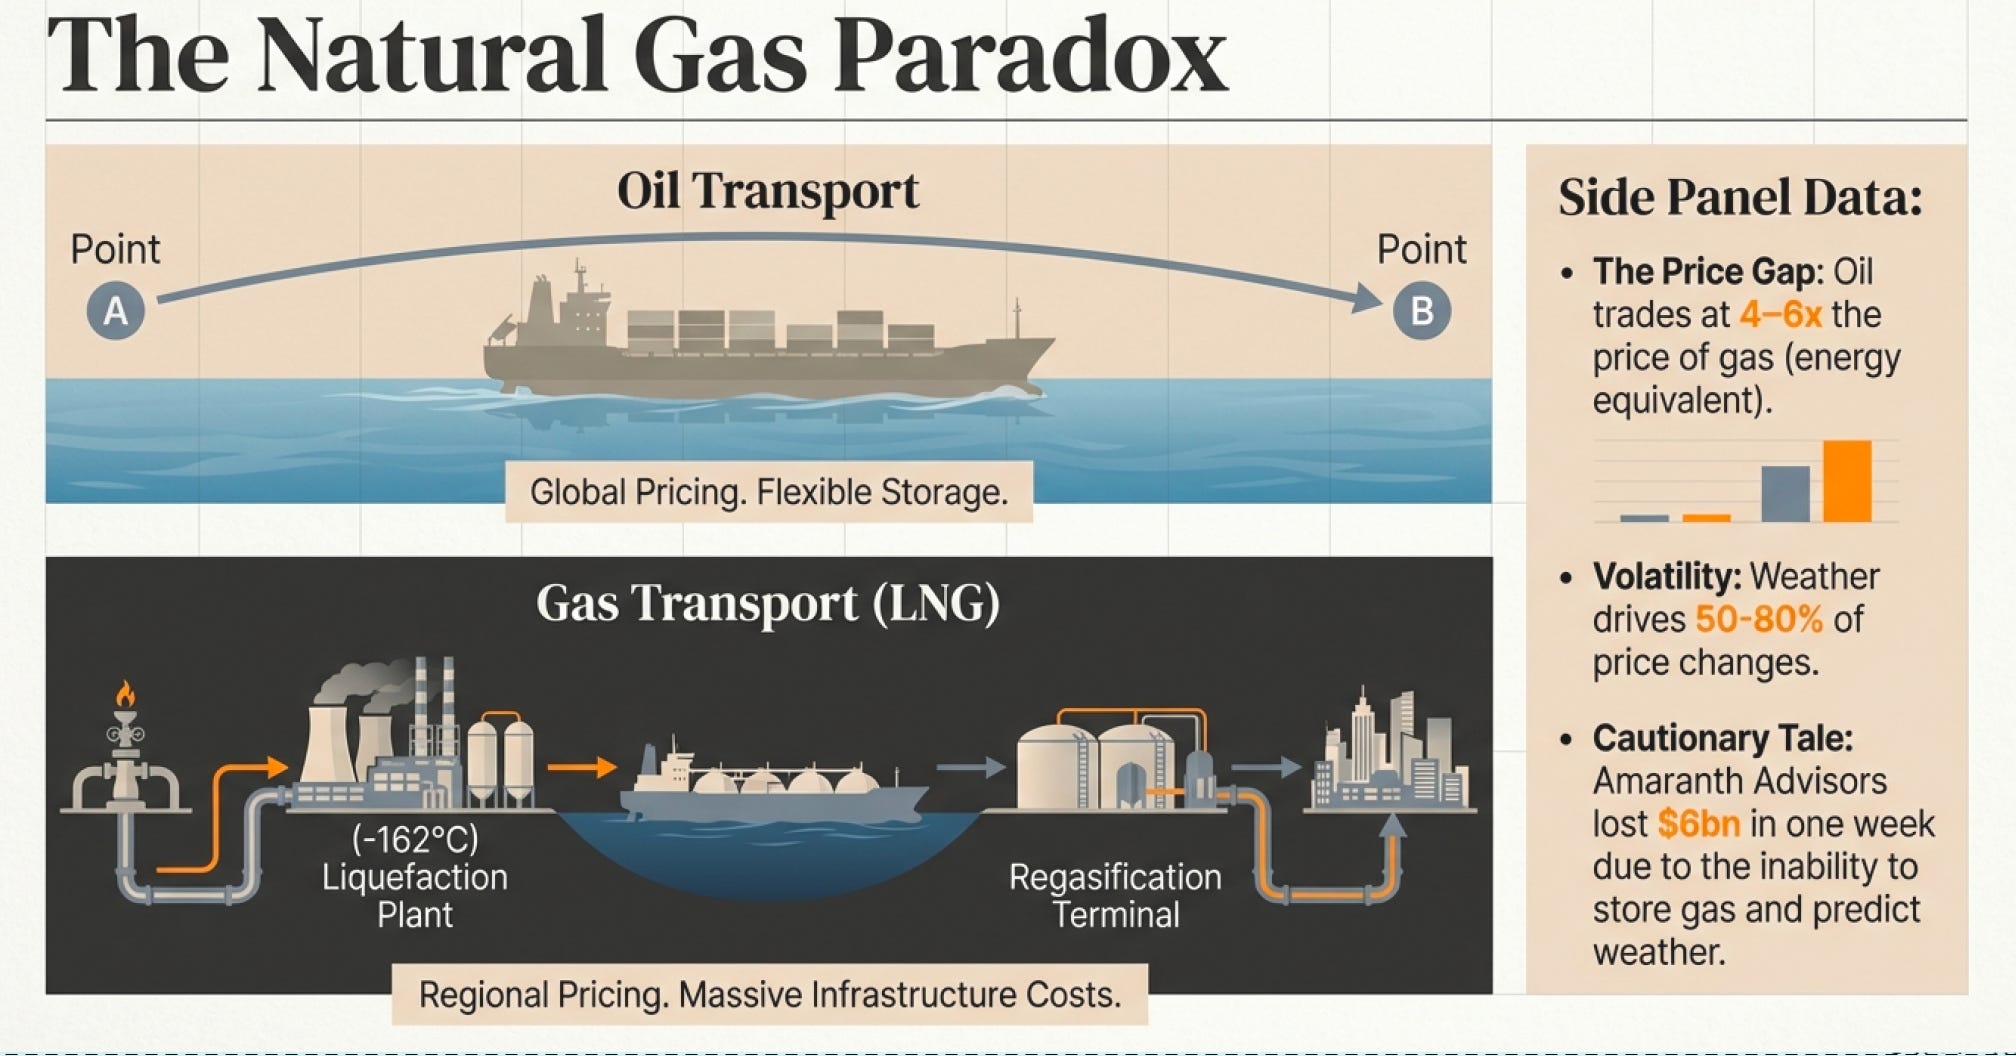
First, oil is a global commodity, but natural gas is priced regionally. You can put oil on a tanker and ship it anywhere in the world relatively cheaply. Natural gas must be either piped (limiting you to regional markets) or cooled to -162°C, compressed to 1/600th its original volume, turned into LNG, placed on specially designed double-hulled ships, shipped to a receiving terminal, regasified, and then piped to customers.
This process works, but it costs real money. The result? Natural gas prices in Japan or Europe can hit $15/MMBtu while U.S. prices sit at $3/MMBtu. The world hasn’t built enough LNG export capacity to fully arbitrage these price differences—yet.
Second, weather explains somewhere between 50-80% of natural gas price volatility. It’s used for heating in winter and air conditioning in summer. A mild winter or cool summer can crater demand and prices. You can’t predict the weather, which means you can’t predict natural gas prices.
Third, storage is limited. Unlike oil, which you can store in tanks relatively easily, natural gas must be stored in underground formations or as LNG, both of which have constraints and costs.
The combination creates extraordinary volatility—the kind that can destroy companies betting on the wrong side of the market. In 2006, Brian Hunter at Amaranth Advisors lost $6 billion in a single week on bad natural gas trades. One week. Six billion dollars. Gone.
This is why Papa’s decision looks brilliant in retrospect. He saw that EOG was too good at finding gas, which meant gas would become cheap, which meant oil was the better business. It wasn’t about drilling technology. It was about supply and demand and having the courage to act on what the data was screaming.
Oil Quality: Why Not All Barrels Are Created Equal
Here’s another geographic determinant that fundamentally shapes company economics: oil quality. And this might be my favorite example of how geology creates business moats that no amount of management skill can overcome.
Not all oil is created equal. You want to know what kind of oil a company produces because the price they receive can vary by $20-30 per barrel based purely on chemistry.
Density/Viscosity (how gooey it is):
Light crude: API gravity higher than 31.1 degrees
Medium crude: 22.3-31.1 degrees
Heavy oil: Lower than 22.3 degrees
Bitumen (oil too viscous to flow on its own): API ≤ 10
Sulfur Content (sweetness):
Sweet crude: Less than 0.5% sulfur
Sour crude: More than 0.5% sulfur
The sweeter and lighter it is, the easier and cheaper to refine into products like gasoline, diesel, and jet fuel. Therefore, the price is higher.
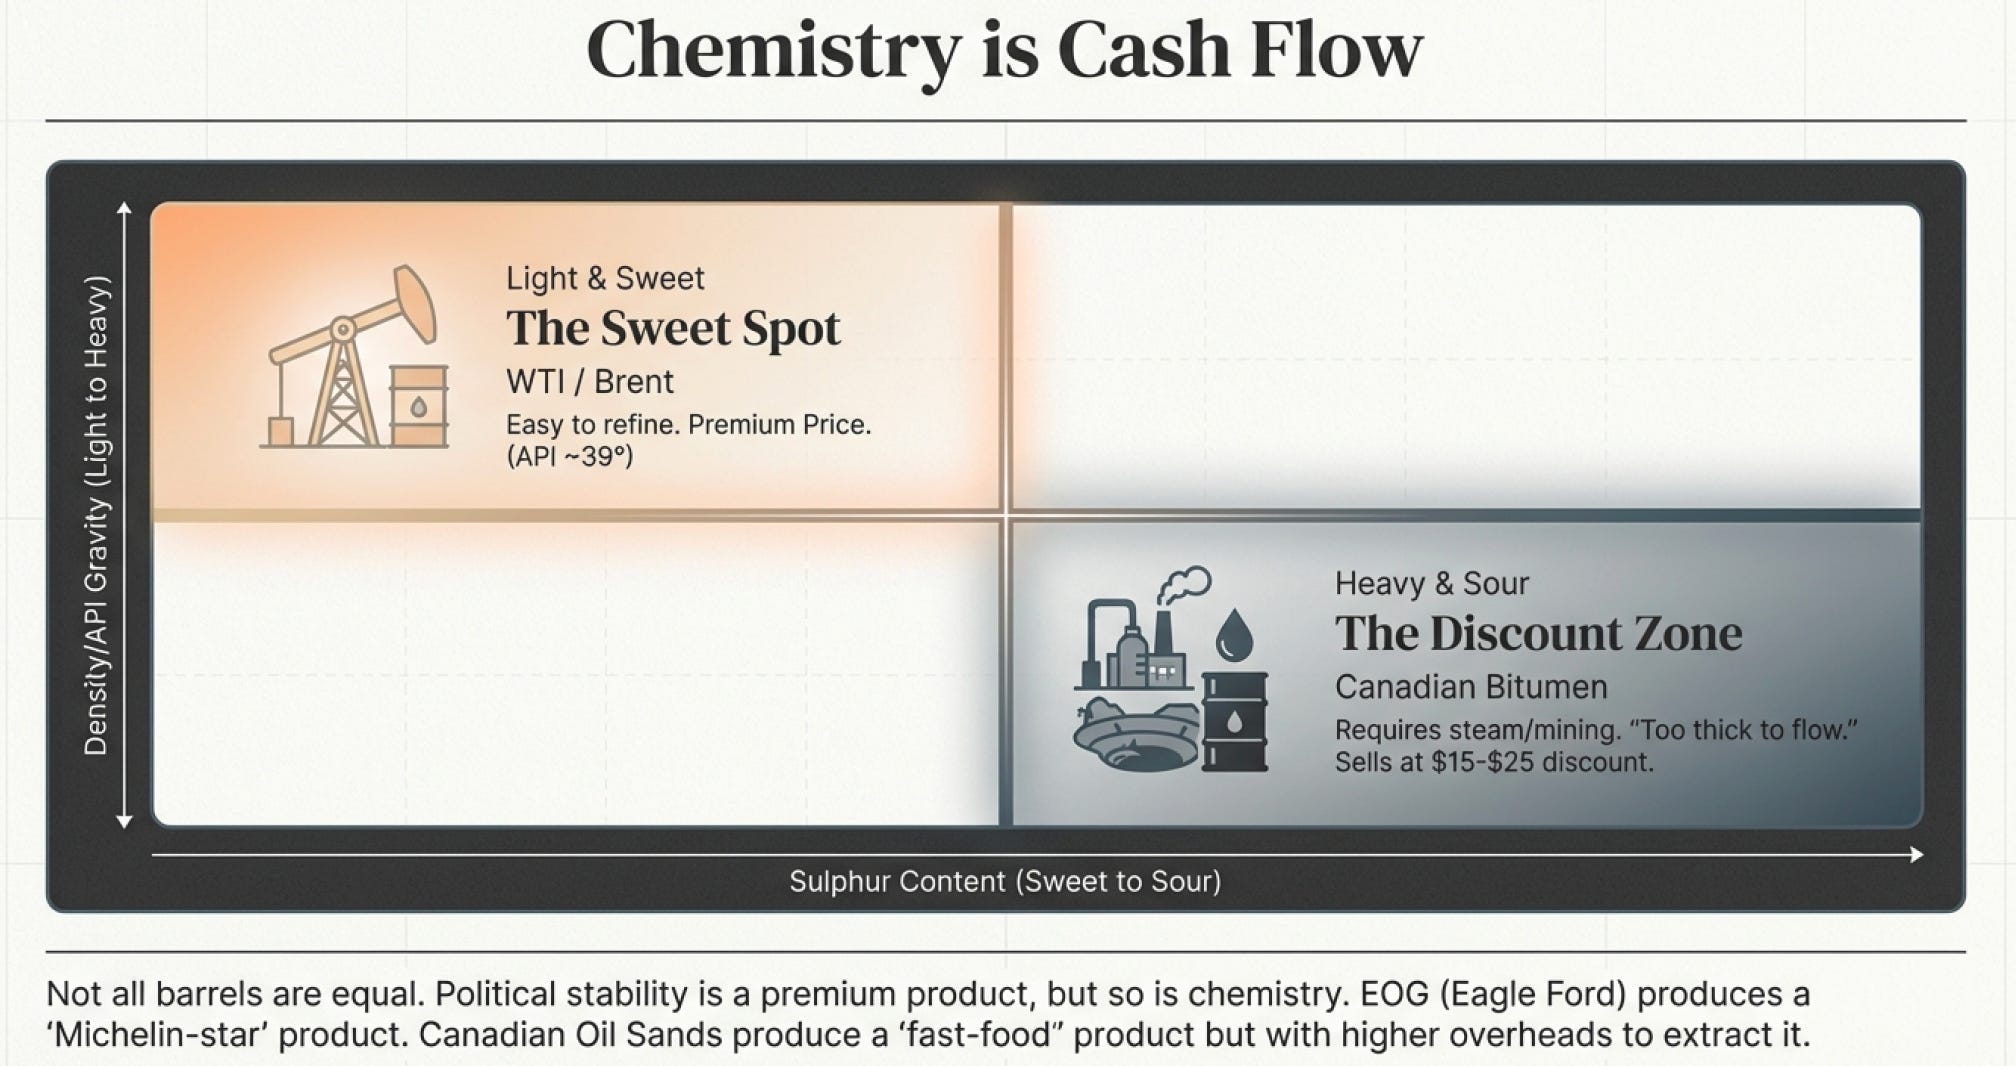
West Texas Intermediate (WTI), the U.S. benchmark, is light sweet crude (API gravity of about 39.6 degrees, sulfur content of 0.24%). It’s some of the world’s highest-quality crude.
Brent crude, the international benchmark from the North Sea, is also light sweet (API 38.06 degrees, sulfur 0.37%).
Canadian oil sands, by contrast, produce heavy sour bitumen (API around 8-12 degrees, sulfur content of 3-5%). It’s so thick it doesn’t flow at room temperature. It requires enormous energy inputs to extract and process, and it sells at a $15-25 per barrel discount to WTI.
Think about the business implications. If you’re Canadian Natural Resources operating in the oil sands, you’re producing crude that:
Requires steam injection or mining to extract (very energy-intensive)
Sells at a significant discount to benchmark prices
Requires specialized refining capacity (which not all refineries possess)
If you’re EOG Resources in the Eagle Ford or Permian, you’re producing light sweet crude that sells at or near WTI prices with much lower production costs per barrel.
Same industry. Completely different businesses. It would be like saying both McDonald’s and a Michelin three-star restaurant are in the “food service industry”—technically true, economically meaningless.
Why Exxon Learned to Love North Dakota
There’s one more critical dimension: political risk.
Many oil- and gas-rich countries don’t take kindly to outside companies making profits from “their” resources, and things can turn ugly in the blink of an eye.
In 2007, Venezuela nationalized its oil and gas assets. In 2012, Argentina seized 51% of YPF from Spain’s Repsol. Russia has a long history of renegotiating terms once foreign companies have invested billions—see what happened to BP’s joint venture TNK-BP, effectively forced to sell to Rosneft in 2013, or ExxonMobil’s Russian operations, essentially frozen after the Ukraine invasion in 2022.
Saudi Arabia and Mexico have barred American and other foreign businesses from their oil for more than half a century. Getting involved in Russia’s oil is risky as the Kremlin balances its position with oligarchs, and oligarchs with foreign enterprise cultures. When geopolitical winds shift, foreign companies are often the first casualties.
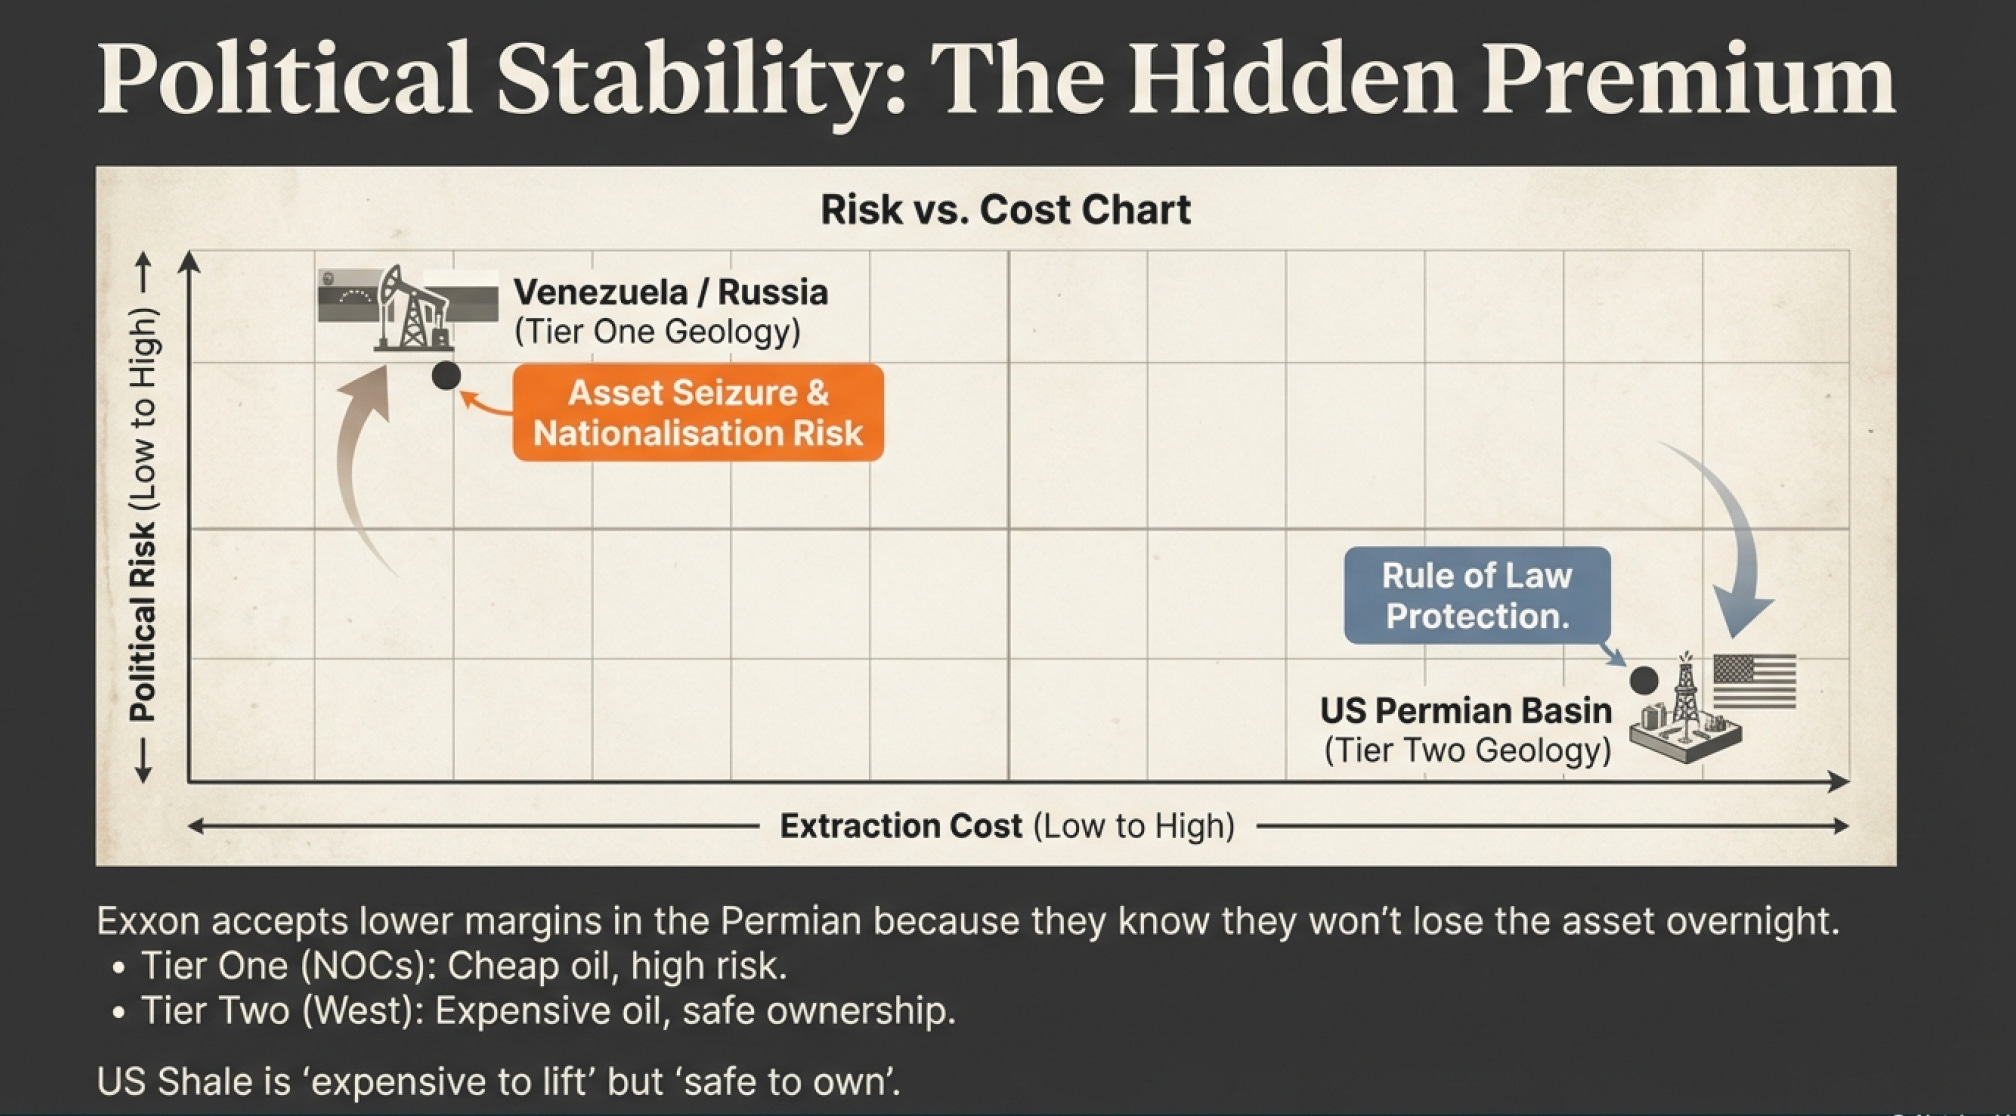
The result? Companies with long-lived oil reserves in countries with low political risk are often better investments than those with cheaper production costs in unstable regions.
This is why U.S. shale became so attractive despite higher production costs. Yes, producing a barrel from the Permian Basin costs more than from Saudi Arabia’s Ghawar field. But you know the rules won’t suddenly change. The government won’t nationalize your assets. Your contract terms will be honored. Property rights are protected.
When ExxonMobil calculates risk-adjusted returns, a barrel of oil from the Permian Basin—despite higher costs—often generates better returns than a barrel from a country where the regulatory and political environment could shift overnight and render your investment worthless.
The Fuel That Funded a Fortune (While Everyone Pretended It Didn’t Exist)
Now here’s where our story takes an uncomfortable turn—uncomfortable because it exposes the gap between what we say and what we do.
In 2012, Ivan Glasenberg, CEO of Glencore—one of the world’s largest natural resource companies—made a fascinating announcement. His company would cap coal production at 150 million tonnes per year and would not buy any more coal mines.
This was the energy equivalent of a tobacco executive in 1995 saying “we’ll keep selling cigarettes, but we’re not expanding.” It was admission and calculation wrapped in one careful statement.
But here’s what makes the story delicious: While Glasenberg was making this announcement to satisfy ESG-conscious investors in London and Zurich, one of his top coal executives was saying something completely different. In private conversations, he argued passionately that coal would remain essential for decades, especially in developing nations like Pakistan, India, Malaysia, and Vietnam.
Both were right. And the tension between these two truths—what we say in boardrooms versus what happens in the real world—explains more about the energy business than any official company presentation.
Let me show you what I mean with a thought experiment. Imagine you’re invited to an energy conference in Manhattan. Expensive suits, better coffee, presentations full of charts showing exponential growth curves for solar and wind. Count how many times you hear “renewable,” “sustainable,” “net-zero,” “energy transition.” You’ll lose count.
Now count how many times you hear “coal.” Maybe once, in a question about “the phase-out timeline.”
Now leave that conference and look at what’s actually being built. As of 2025, China operates 1,100 gigawatts of coal power and is constructing 95 GW more. India relies on coal for 75-80% of electricity and plans to add 88 GW more thermal capacity by 2032.
We’re not talking about maintaining old plants. We’re talking about pouring concrete for new coal plants. In 2025. With financing, permits, and ribbon-cutting ceremonies. While people in air-conditioned conference rooms give PowerPoint presentations about phasing out fossil fuels.
This is the energy industry’s magnificent contradiction, and understanding it tells you more about how the global energy business works than any earnings call or analyst report.
Here’s why coal persists, and why geography and economics trump good intentions every single time: Coal is cheap. Coal is abundant. Coal works with infrastructure that took decades and trillions of dollars to build. You can’t just walk away from a trillion-dollar coal ecosystem because solar panels got 30% cheaper.
Let me put the scale in perspective: Three-quarters of coal is used to generate electricity, and it generates 40% of the world’s electricity—not because people love carbon emissions, but because it’s cheaper than oil and, in many developing countries, more reliable than natural gas. Steel manufacturing, which accounts for about 60% of metallurgical coal demand, depends overwhelmingly on coal. You literally cannot make steel at scale without coking coal.
Those “green” electric vehicles everyone celebrates? The steel in them came from coal. The concrete in those wind turbine foundations? Made with energy from coal. It’s turtles all the way down.
And here’s where our earlier stories about geography and political risk connect in unexpected ways.
When Geography Meets Desperation (The Indonesian Mining Race)
Remember how we talked about Saudi Arabia’s $2/barrel lifting costs creating an unbeatable competitive advantage? Coal has its own version of that story, except it’s a race to the bottom in the most literal sense.
Coal mining is conceptually simpler than oil drilling—you’re not dealing with liquids under pressure miles beneath the ocean. You’re digging up rock. But simple doesn’t mean equal, and geography creates wildly different economics.
There are three basic approaches:
Underground shaft mining (anything more than 120 meters deep): Dangerous and expensive. You need heavy automated equipment to reach the coal seam while leaving columns of coal to prevent the roof from collapsing. Conveyor systems haul everything back to the surface. This is the coal equivalent of deep-water oil drilling—technically impressive, economically challenging.
Open pit/surface mining: Faster, cheaper, safer because the coal is near the surface. You use excavators, massive dump trucks, and conveyor belts. If geology allows it, this is always better than shaft mining. It’s like the difference between picking apples from a tree versus digging them up from underground.
Mountaintop removal: Exactly what it sounds like—blast the top off a mountain to access the coal beneath. Environmentally catastrophic, operationally efficient.
Now, just like oil, not all coal is created equal. Coal is classified by carbon content:
Lignite → Sub-bituminous → Bituminous → Anthracite (least to most carbon)
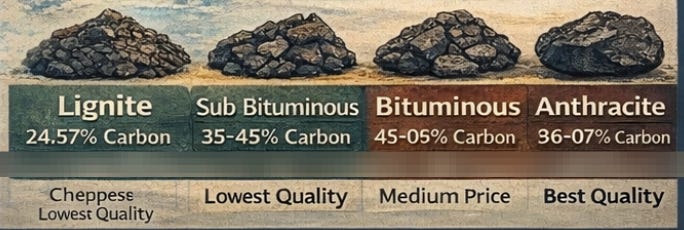
Drier, harder coal with higher carbon content is worth significantly more—sometimes 3-4x the price. It contains more energy per ton, which means you transport and burn less of it for the same electricity output. Basic physics creating economic moats.
And this brings us to one of the strangest competitive dynamics in the energy business: Indonesia versus Australia.
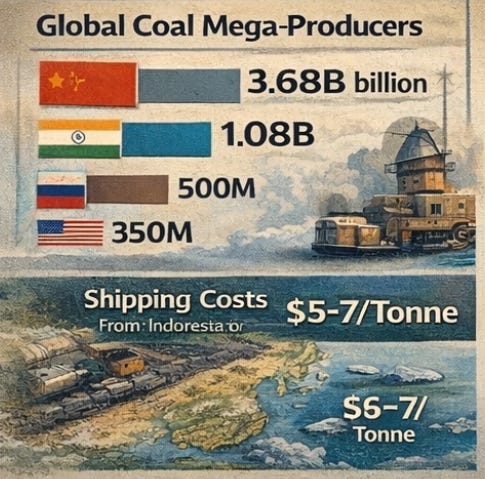
Indonesia and Australia together supply 45% of global seaborne coal trade. But here’s the plot twist: Indonesia leads the world in coal exports but doesn’t even make the top ten in reserves.
Think about what that means. Indonesia had roughly 5.5 billion tonnes of coal reserves in 2011 and exports 82% of its annual production. At current extraction rates, Indonesia is essentially mining itself into oblivion—they’ll exhaust economically viable reserves within decades. They’re converting their entire coal endowment into cash as quickly as possible.
This isn’t irrational. It’s the opposite. Indonesia has massive open-pit mines with low production costs, and they’re located right next door to the world’s fastest-growing coal markets: China, India, Japan, South Korea. Ship a ton of coal from Indonesia to Guangzhou, and you’ve traveled about 1,700 nautical miles. Ship it from Australia, and you’ve traveled 3,000 nautical miles. From the U.S. East Coast? Over 9,000 nautical miles.
Geography is destiny, again.
Indonesia is playing a brilliant short-term game: extract cheaply, sell nearby, move volume. Australia has a different strategy because it faces different geology. Australia sits on approximately 150 billion tonnes of reserves—among the world’s largest—and produces high-quality bituminous coal that commands premium prices. They’re playing the long game because they can.
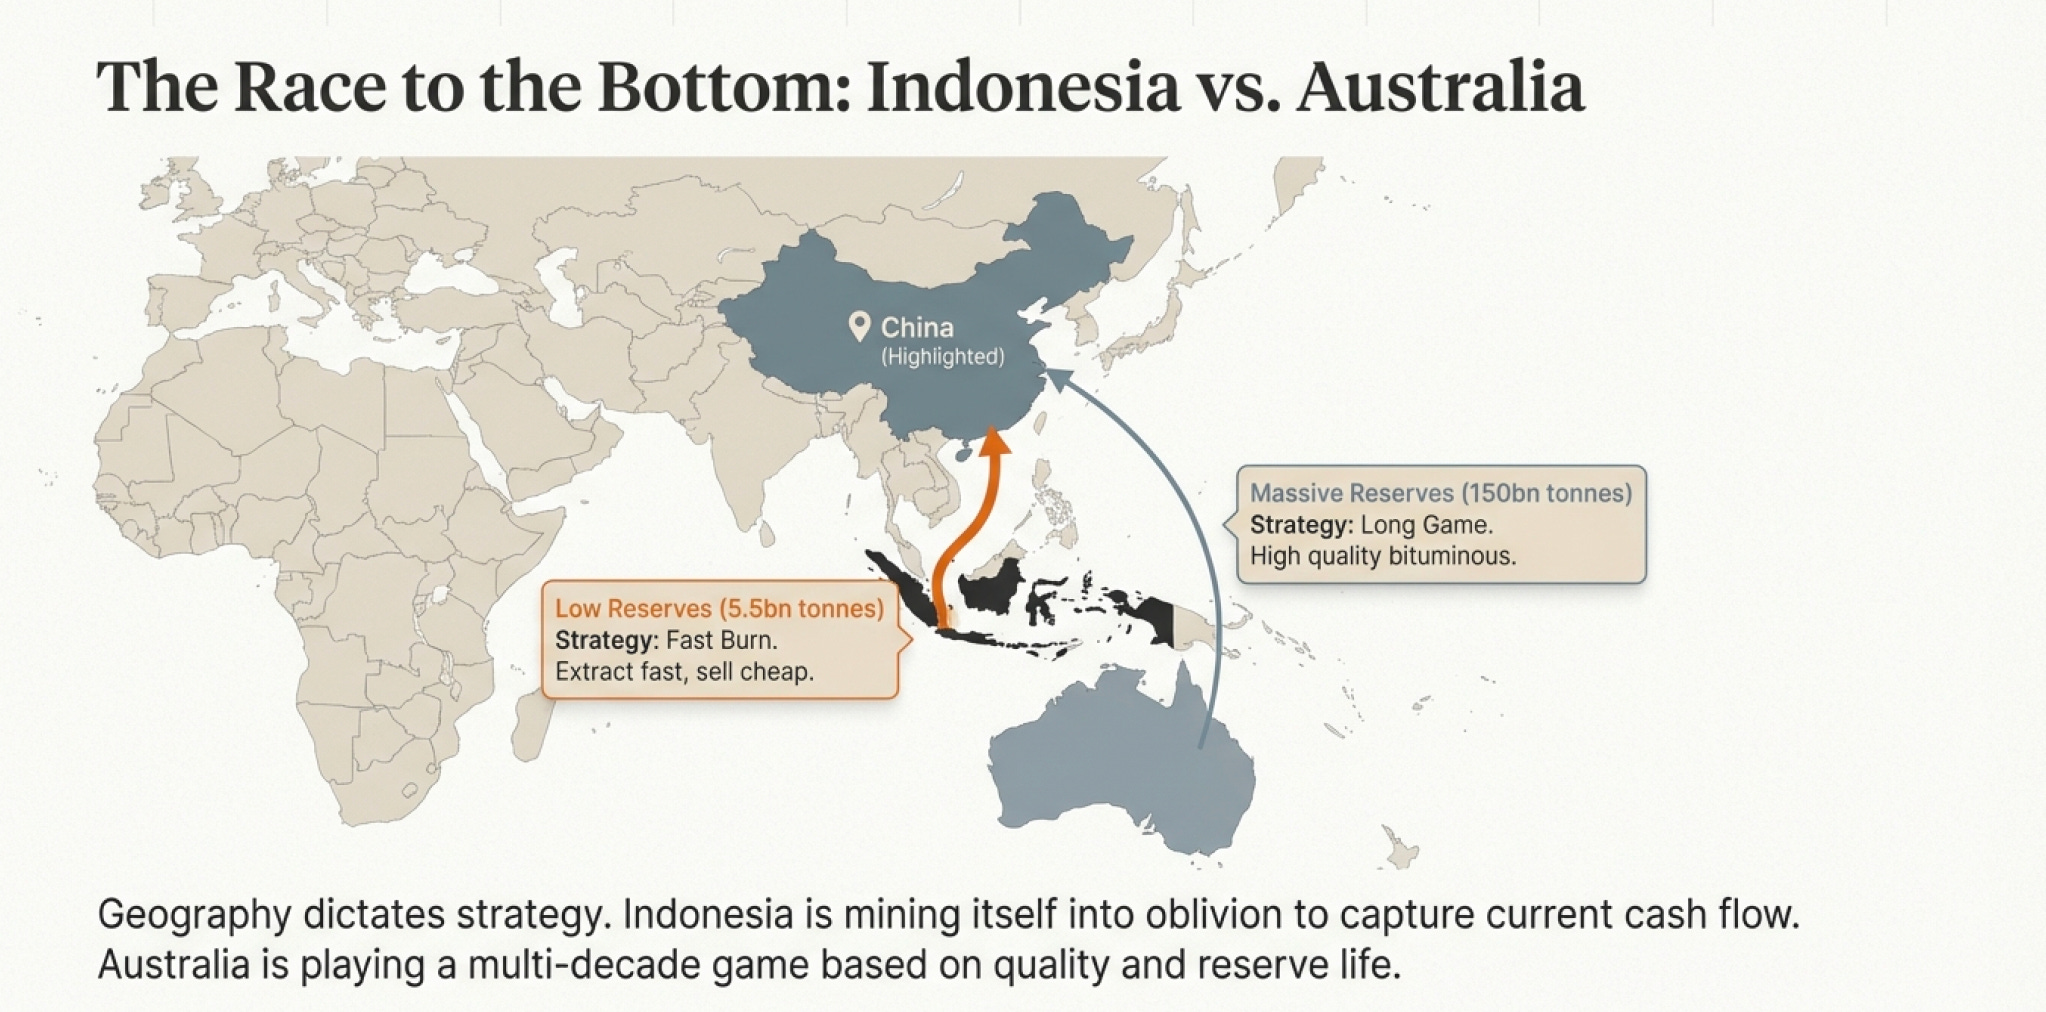
The Australian export price for thermal coal is the global benchmark because Australia exports more than 80% of its production to Asia, and that coal is high-quality stuff that sets the market price.
Think about the business implications. If you’re an Indonesian coal producer, you’re optimizing for cash flow today because your reserves are finite and depleting fast. Every year you don’t mine is potential value left in the ground while competitors capture market share. If you’re an Australian producer, you have a decades-long runway and can focus on efficiency, quality, and sustainability (ironically) because you’re not in a desperate race.
Same commodity. Completely different business strategies driven entirely by geology and geography.
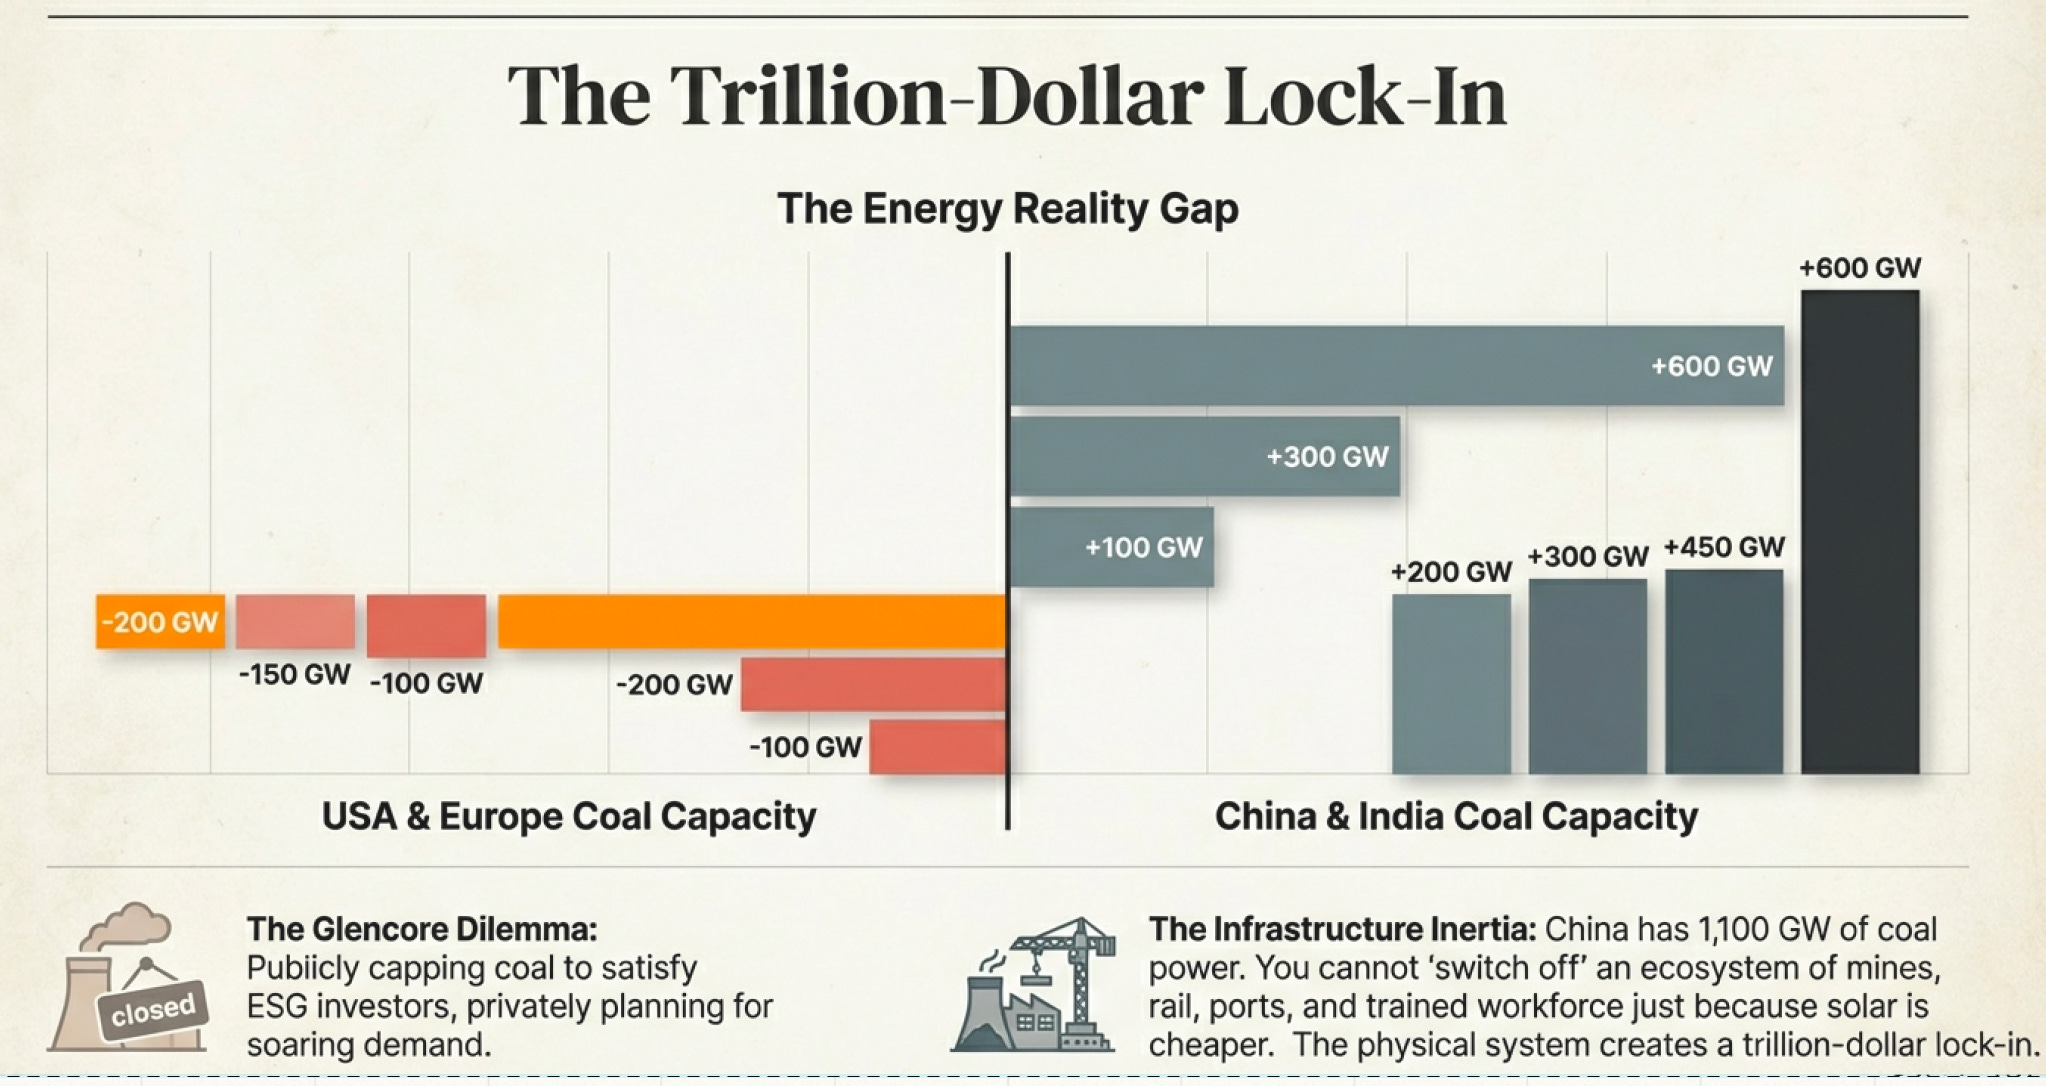
The Trillion-Dollar Lock-In - Why China Can’t Just Switch Off Coal
Here’s where coal gets really fascinating, and where our earlier stories about Papa’s natural gas insight and political risk converge in unexpected ways.
Natural gas is abundant and cheap in the United States, and it burns much cleaner than coal. The projected cost of “clean coal” technology—carbon capture and sequestration (CCS)—exceeds the cost of just burning natural gas in most developed markets. So why doesn’t everyone just switch?
Because the world doesn’t run on spreadsheets. It runs on concrete, steel, trained workers, and infrastructure that took decades to build.
Consider China’s predicament. China hasn’t been able to fully leverage its substantial natural gas reserves due to adverse geology—the gas deposits are in difficult locations far from population centers. But that’s only part of the story. The other part is timing and infrastructure lock-in.
Building a coal plant takes 2-4 years. Building a natural gas plant takes 4-6 years. When you’re trying to electrify a nation of 1.4 billion people as fast as possible, that timing difference is enormous. But more importantly, China has spent decades building:
Coal power plants (1,100 GW of capacity)
Coal mines to supply those plants
Rail lines to transport coal from mines to plants
Ports to import coal from Indonesia and Australia
An entire workforce trained to operate coal infrastructure
Supply chains for spare parts and maintenance
Power grids designed around coal’s characteristics
This isn’t just sunk cost. It’s embedded infrastructure representing trillions of dollars and millions of jobs. You don’t just abandon that because solar panels got cheaper or natural gas looks attractive on paper.
Here’s a thought experiment: Imagine you’re a Chinese grid operator. Your mandate is to keep electricity flowing to factories, homes, and hospitals. You have:
Option A: Coal plants that you know work, with fuel supplies you control, operated by workers with decades of experience, connected to infrastructure that’s proven reliable.
Option B: Switch to natural gas, which requires building entirely new plants, new pipelines, importing LNG (making you dependent on foreign suppliers), retraining workers, and hoping everything works smoothly while you make the transition.
Which would you choose? Especially when your political survival depends on keeping the lights on?
This is why coal consumption isn’t going down globally, even as it declines in wealthy countries. Over the last three decades, electricity production from coal has grown more than 200% worldwide. Not because people are ignorant about climate change, but because coal provides reliable, affordable baseload power that billions of people desperately need right now.
The South African Solution - When Necessity Becomes Innovation
There is a future where coal becomes cleaner, and the path to it was paved by one of history’s more ironic situations.
During apartheid, South Africa faced international economic embargoes and was cut off from oil imports. They had abundant coal but no oil. So they did what desperate people with smart engineers often do: they innovated.
South Africa developed coal-to-liquid technology at scale. Through gasification—a process that separates and removes chemicals to eliminate 99% of pollutants while making plants 40-70% more efficient—they could convert coal into synthetic liquid fuels. The gas produced can be further refined using Fischer-Tropsch techniques into products virtually identical to petroleum-based diesel and gasoline.
Today, about 30% of South Africa’s diesel and gasoline requirements still come from coal. The market leader in this technology is Sasol (NYSE: SSL), which built an entire business around making coal work when oil wasn’t available.
The technology works. It’s commercially proven at scale. So why isn’t everyone doing it?
Because of the curse we saw earlier with integrated oil companies: coal is competitive on its own, but becomes prohibitively expensive when you add clean-coal technology.
Here’s the economics: Burning raw coal might cost $40 per megawatt-hour of electricity. Burning natural gas might cost $50 per megawatt-hour. Adding CCS to coal? Now it costs $80-120 per megawatt-hour, depending on the technology and carbon price.
For a developed country with access to cheap natural gas and the wealth to pay premium prices for cleaner energy, the choice is obvious: switch to gas or renewables.
For a developing country where a significant portion of the population lacks reliable electricity access, and where every dollar spent on expensive “clean” energy is a dollar not spent on schools, hospitals, or roads, the choice is equally obvious: burn the cheap coal and deal with environmental consequences later.
This creates the fundamental division in global coal consumption: Developed countries can afford to phase out coal because they have alternatives and can absorb higher energy costs. Developing countries can’t, or more accurately, won’t—not when coal provides the reliable, affordable baseload power their populations need to escape poverty.
Remember Glasenberg’s dilemma at Glencore? He had to satisfy ESG-conscious investors in wealthy countries while his coal business executives saw massive ongoing demand in developing countries. Both were reading the same market correctly—they were just looking at different parts of it.
And that brings us to where all of this—oil, gas, and coal—is heading.
The Asian Pivot (Where the Future Is Being Written)
While we’ve focused on who produces oil, gas, and coal, we need to understand who consumes it—because this is reshaping everything.
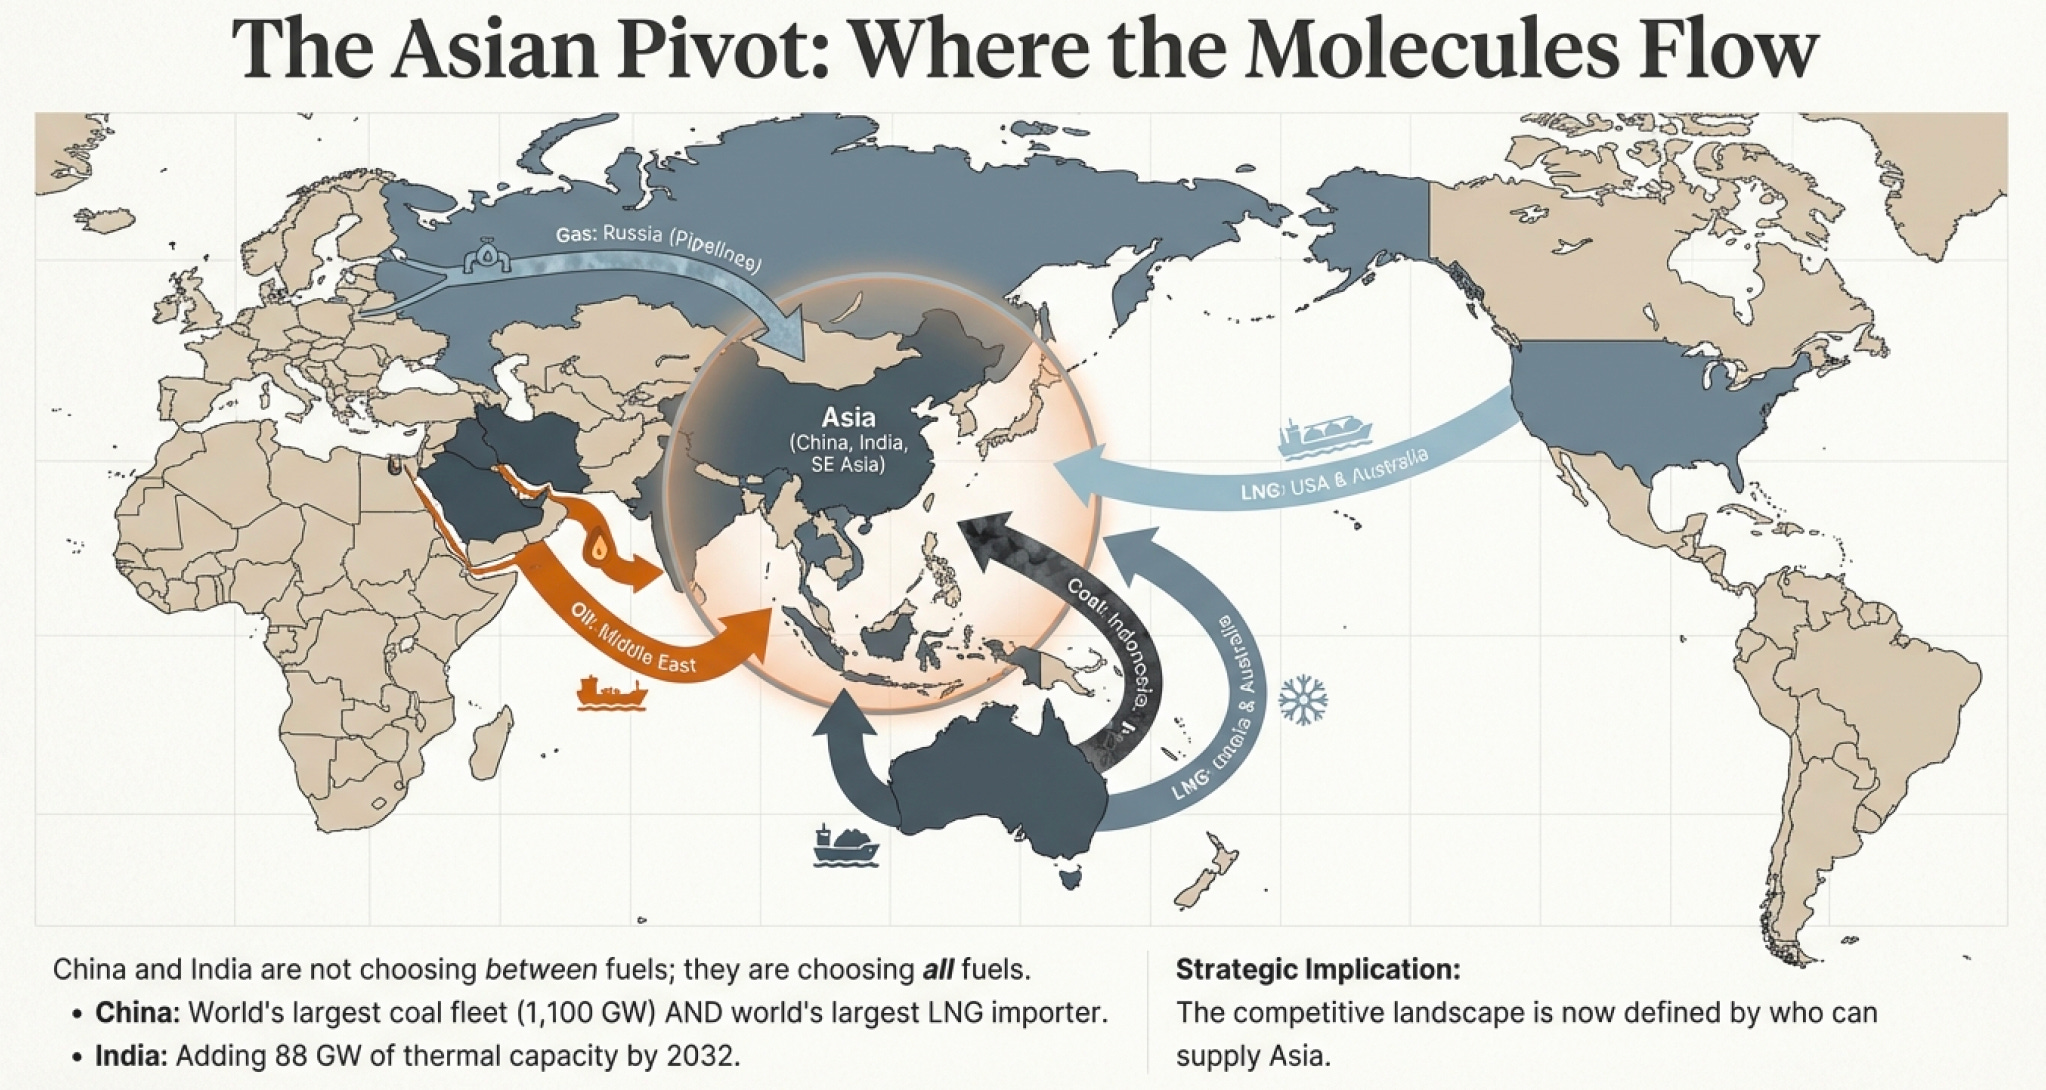
As of 2025, Asia Pacific generates the highest demand for fossil fuels globally, and this trend is accelerating. China and India are investing extensively in both upstream and downstream operations across all three fuels.

PetroChina, ranked fifth globally by market cap at $196 billion, produces 2.5 million barrels of oil per day and recorded 4.9 trillion cubic feet of natural gas in 2023. China has the world’s largest coal power fleet (1,100 GW) but also dominates global LNG imports, consuming over 70 million tonnes annually. They’re not choosing between energy sources—they’re using all of them because they need all of them.
India relies on coal for 75-80% of electricity but is adding oil and gas consumption even faster than China in percentage terms. India plans to add 88 GW more thermal capacity by 2032 to meet surging energy demand.
What does this mean for the competitive landscape?
First, NOCs in the Middle East have a structural advantage in oil. Their crude is cheap to produce, and they’re geographically closer to Beijing and New Delhi than Texas or North Dakota.
Second, LNG has become the strategic battleground for natural gas. Qatar, Australia, and the United States are racing to expand LNG export capacity. TotalEnergies targets LNG sales of 50 million tonnes per year by 2030. ExxonMobil’s natural gas output is anticipated to reach 7.7 billion cubic feet daily by 2025.
Third, coal trade flows are being redrawn. Indonesia and Australia compete to supply Asia’s coal appetite, with Indonesia winning on proximity and Australia winning on quality and reserve life.
Fourth, whoever controls low-cost supply to Asian markets will dominate the next 20 years of industry growth. This is why you see Russian pipeline gas to China, Middle Eastern LNG to Japan and South Korea, Indonesian coal to India, and U.S. shale gas being converted to LNG for export.
The competitive landscape isn’t just about who has the cheapest oil, gas, or coal—it’s about who can deliver energy reliably to the world’s fastest-growing consumers at competitive prices. And increasingly, that means understanding not just production economics but shipping routes, pipeline politics, and the infrastructure lock-ins that make switching energy sources nearly impossible in the short term.
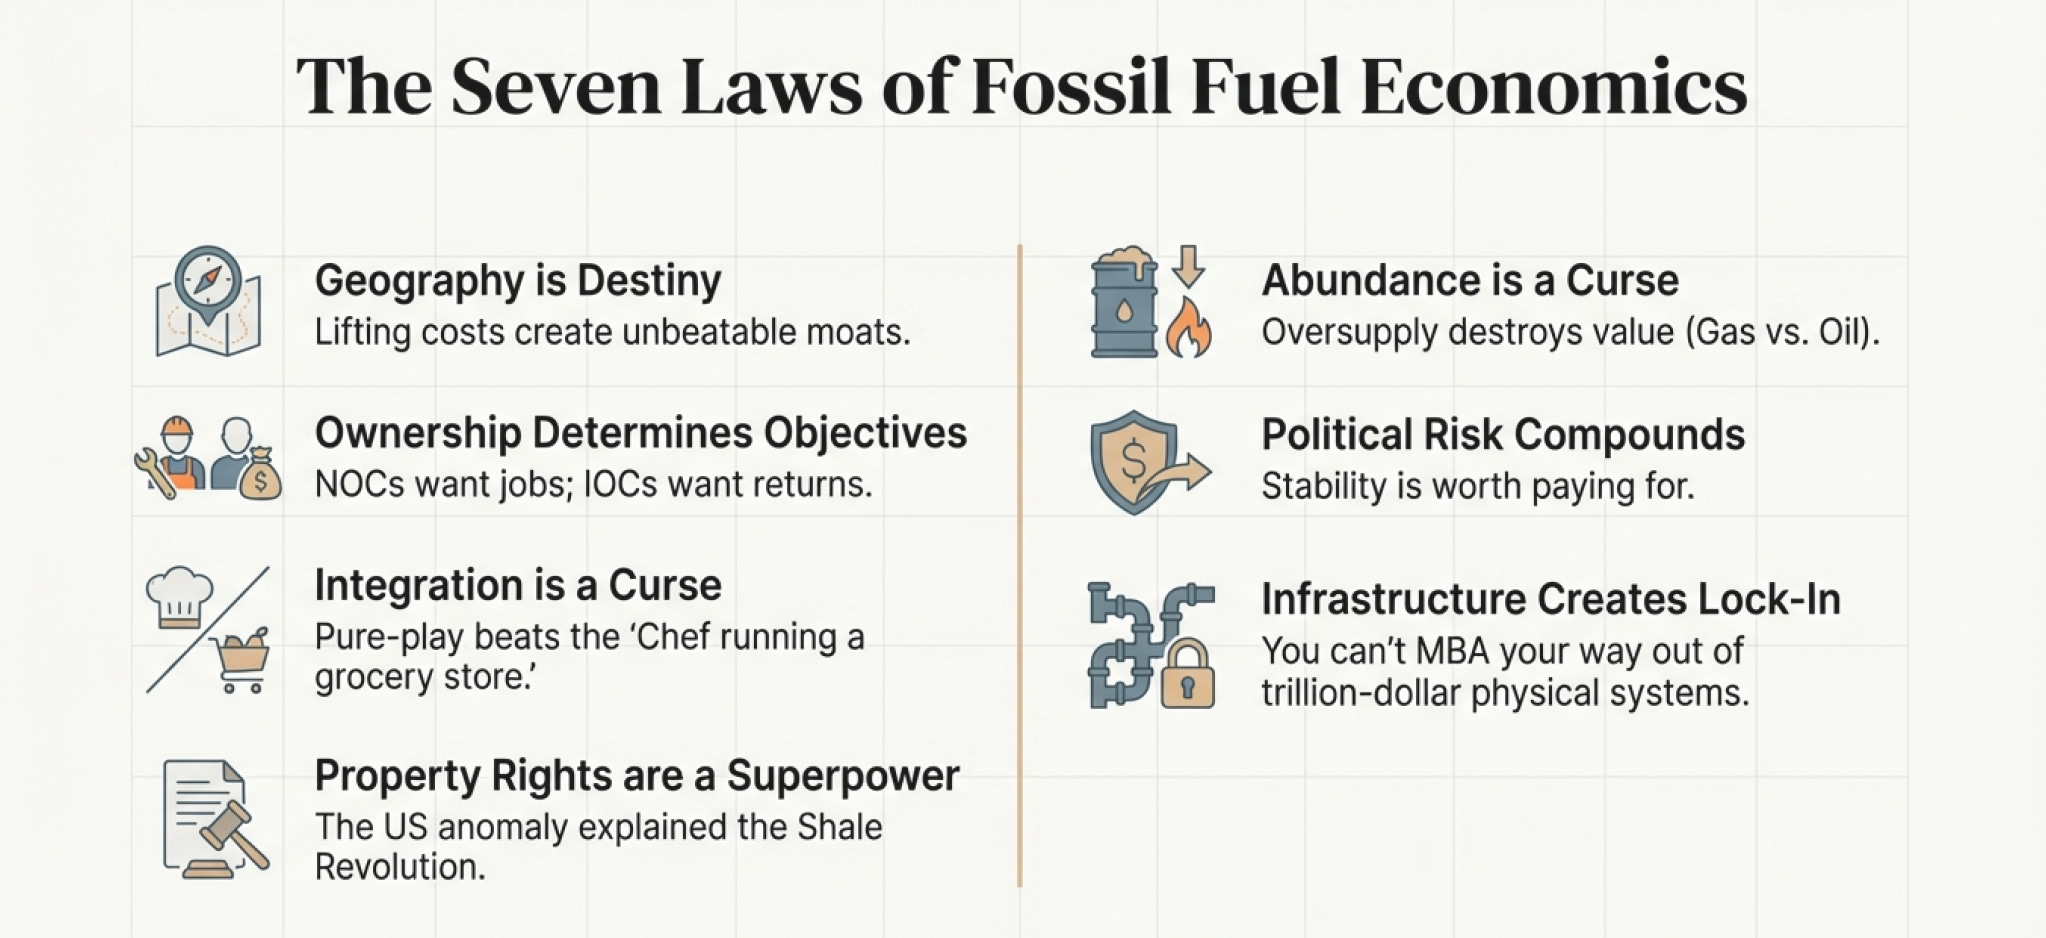
The Seven Laws of Fossil Fuel Economics
So where does this leave us? After all these stories—from Papa’s gamble to Glasenberg’s dilemma, from Venezuela’s collapse to China’s coal dependence—what have we actually learned about understanding this industry?
Here are the fundamental dynamics:
1. Geography is destiny. The quality of your reserves, their proximity to markets, and the political stability of where you operate matters more than almost anything else. Saudi Aramco’s $2/barrel lifting costs create a moat that no management team can overcome. Indonesia’s proximity to Asian coal markets explains their strategy of rapid depletion.
2. Ownership structure determines objectives. NOCs optimize for political objectives—employment, local content, state revenue. IOCs must deliver returns or face activist investors. These different mandates create fundamentally different strategies and explain behaviors that look irrational until you understand the incentives.
3. Integration is often a curse, not a blessing. Pure-play upstream companies like EOG Resources often outperform integrated majors because they’re not dragging along low-margin refining operations. Diversification sounds prudent until you realize you’re averaging great businesses with terrible ones.
4. The shale revolution was a property rights revolution. Private mineral ownership created conditions for entrepreneurial risk-taking at a scale impossible in NOC-dominated systems. This continues to give U.S.-based companies unique advantages in innovation and operational flexibility.
5. Abundance can be a curse. Papa’s insight about natural gas proved prophetic—sometimes being too good at finding something destroys its value. This explains the 4-6x price differential between oil and gas on an energy-equivalent basis and why companies pivoted from gas to oil over the past 15 years.
6. Political risk compounds over time. A field in Venezuela might look more profitable than one in Texas based on production costs alone, but risk-adjusted returns tell a different story. Stability matters more than most financial models capture.
7. Infrastructure creates lock-in effects. China can’t just “switch off” coal because trillions of dollars of infrastructure depends on it. This same logic applies to oil refineries, natural gas pipelines, and LNG terminals. Past decisions constrain future options more than most people realize.
Where Theory Meets Rock
Understanding this competitive landscape is essential, but it’s only half the story. We’ve talked about who drills, where they drill, what economic and political forces shape the industry, and why coal refuses to die despite everyone at conferences pretending it already has.
But we haven’t yet discussed the most fundamental question: How does this actually work?
How do you measure reserves? What’s the difference between proven and probable? What’s a P90 versus P50 reserve? How do production profiles change over time? What determines whether a field is economic? How do companies decide where to drill next? What’s a decline curve, and why does it matter more than any press release?
These aren’t just technical details—they’re the mechanics that determine whether a company printing impressive presentations is actually creating value or destroying capital. They’re the difference between Mark Papa’s brilliant insight in 2007 and countless other executives who made similar bets and failed.
In the next section, we’ll dive into the technical infrastructure of the industry—the vocabulary, metrics, and physical realities that separate companies generating returns from those merely burning capital while appearing busy.
Because in the end, this industry isn’t built on press releases and market cap comparisons. It’s built on understanding reserve lives, decline curves, break-even prices, and the brutal physics of extracting hydrocarbons from miles underground. That’s where the real competitive advantages reveal themselves. That’s where fortunes are made and lost.
And that’s where things get really interesting.
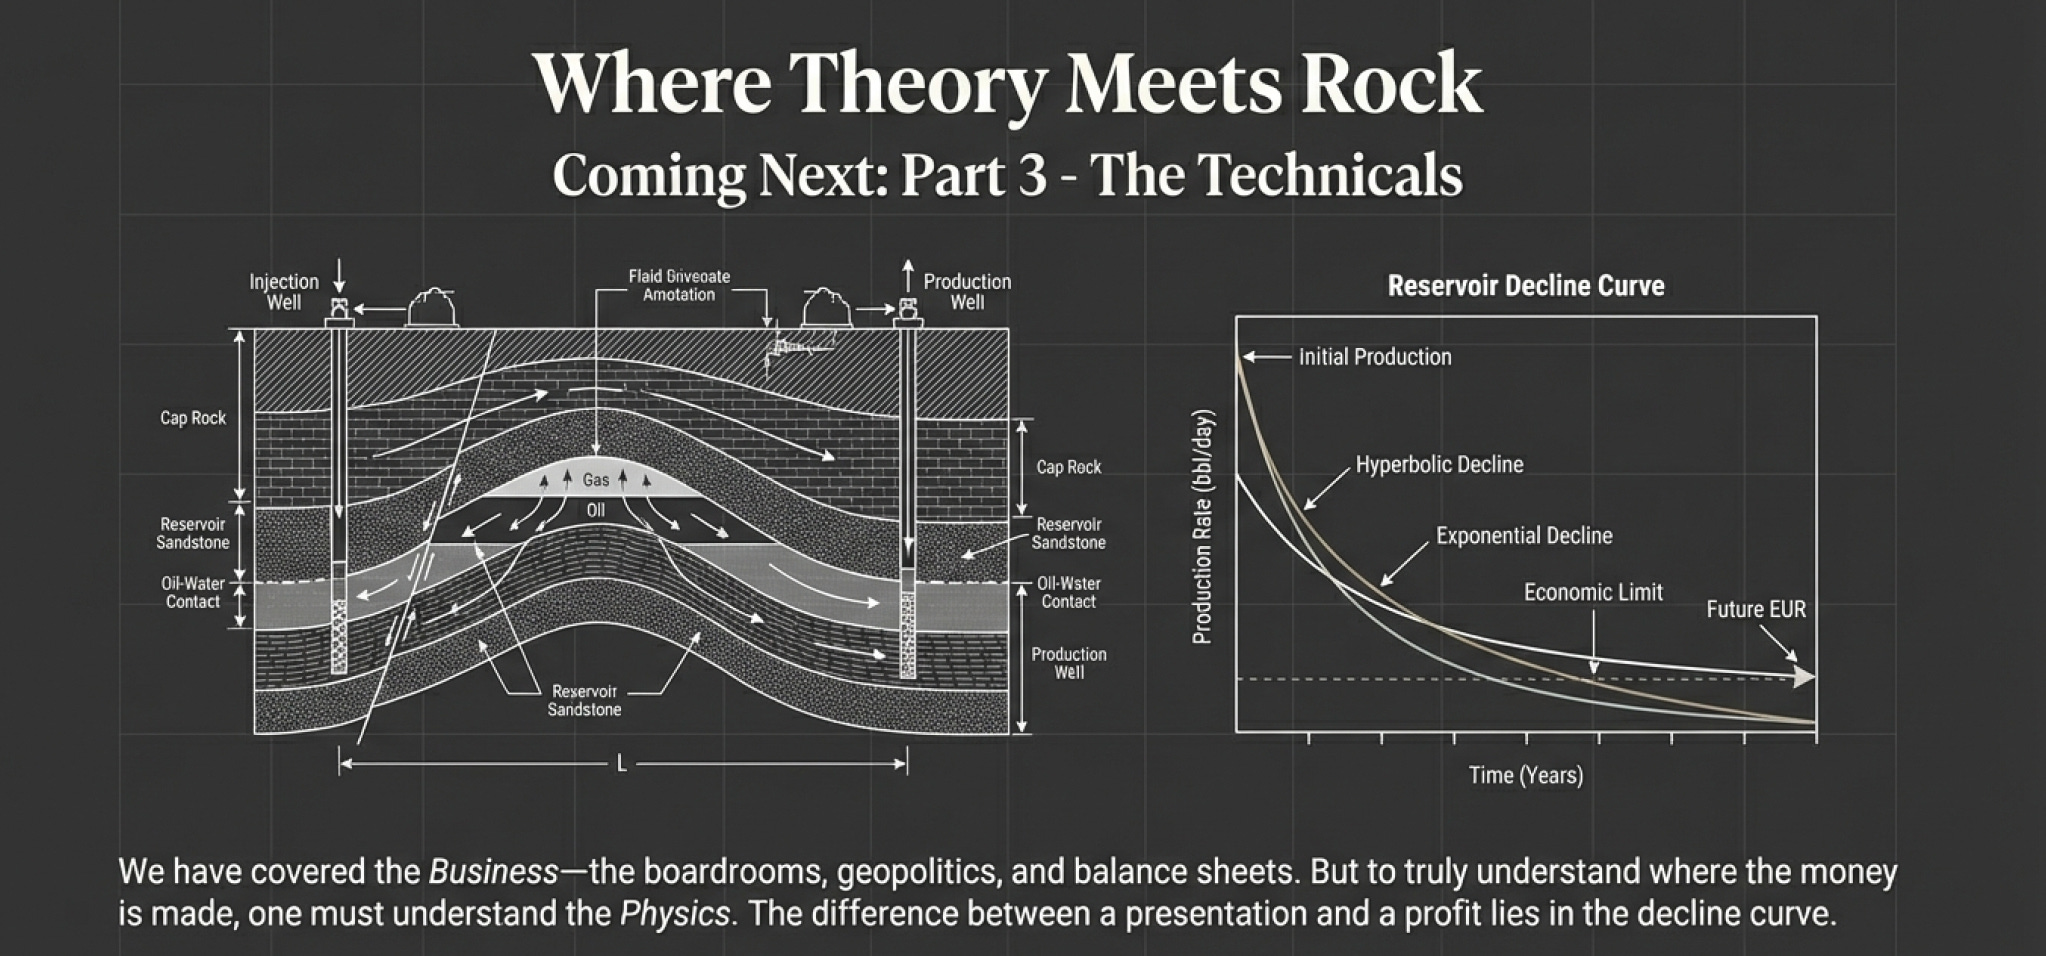
Next up: The technical details that actually matter—where we learn to speak the language of the oil field and understand what separates a good well from a mediocre one, and why that difference is worth billions.
Click here for Part 3 on Technicals:
References
BP p.l.c. (2024). Statistical review of world energy 2024. https://www.bp.com/statisticalreview
U.S. Energy Information Administration. (2024). U.S. crude oil production. https://www.eia.gov
U.S. Energy Information Administration. (2024). Natural gas explained. https://www.eia.gov/energyexplained/natural-gas
U.S. Energy Information Administration. (2024). Coal explained. https://www.eia.gov/energyexplained/coal
International Energy Agency. (2024). World energy outlook 2024. https://www.iea.org
International Energy Agency. (2023). Coal 2023: Analysis and forecast to 2026.
https://www.iea.org
International Energy Agency. (2024). Gas market report. https://www.iea.org
International Energy Agency. (2024). Oil market report. https://www.iea.org
Yergin, D. (2011). The quest: Energy, security, and the remaking of the modern world. Penguin Press. https://www.penguinrandomhouse.com
Smil, V. (2017). Energy and civilization: A history. MIT Press. https://mitpress.mit.edu
EOG Resources, Inc. (2008–2015). Form 10-K annual reports. https://www.sec.gov
Saudi Aramco. (2019). Initial public offering prospectus. https://www.saudiaramco.com
OPEC. (2024). Annual statistical bulletin. https://www.opec.org
Rystad Energy. (2023). Global upstream cost curve. https://www.rystadenergy.com
Wood Mackenzie. (2023). Upstream oil and gas costs. https://www.woodmac.com
McKinsey & Company. (2022). Global oil and gas industry outlook. https://www.mckinsey.com
World Bank. (2019). National oil companies and value creation. https://www.worldbank.org
International Monetary Fund. (2018). Fiscal regimes for extractive industries. https://www.imf.org
Council on Foreign Relations. (2023). Venezuela’s oil collapse. https://www.cfr.org
Reuters. (2023). Venezuela oil production and PDVSA decline. https://www.reuters.com
CME Group. (2024). Crack spread futures explained. https://www.cmegroup.com
American Petroleum Institute. (2023). API gravity and crude oil classifications. https://www.api.org
Alberta Energy Regulator. (2023). Oil sands technical data. https://www.aer.ca
World Coal Association. (2023). Coal types and uses. https://www.worldcoal.org
U.S. Geological Survey. (2023). Coal reserves by country. https://www.usgs.gov
Australian Government, Department of Industry. (2023). Resources and energy quarterly. https://www.industry.gov.au
Indonesian Ministry of Energy and Mineral Resources. (2023). Coal production and export statistics. https://www.esdm.go.id
Global Energy Monitor. (2024). Global coal plant tracker. https://globalenergymonitor.org
National Energy Administration of China. (2024). China power sector statistics. http://www.nea.gov.cn
Ministry of Power, Government of India. (2023). National electricity plan. https://powermin.gov.in
Oxford Institute for Energy Studies. (2023). Global LNG outlook. https://www.oxfordenergy.org
U.S. Department of Energy. (2023). Liquefied natural gas exports. https://www.energy.gov
Sasol Limited. (2023). Integrated report. https://www.sasol.com
Intergovernmental Panel on Climate Change. (2023). AR6 synthesis report. https://www.ipcc.ch