
🛢️Basic Energy Primer Part 1 - Industry Fundamentals
The Fossil Fuel Industry Fundamentals: Reading the Language Written in Rock

The $7 Billion Mistake Nobody Saw Coming
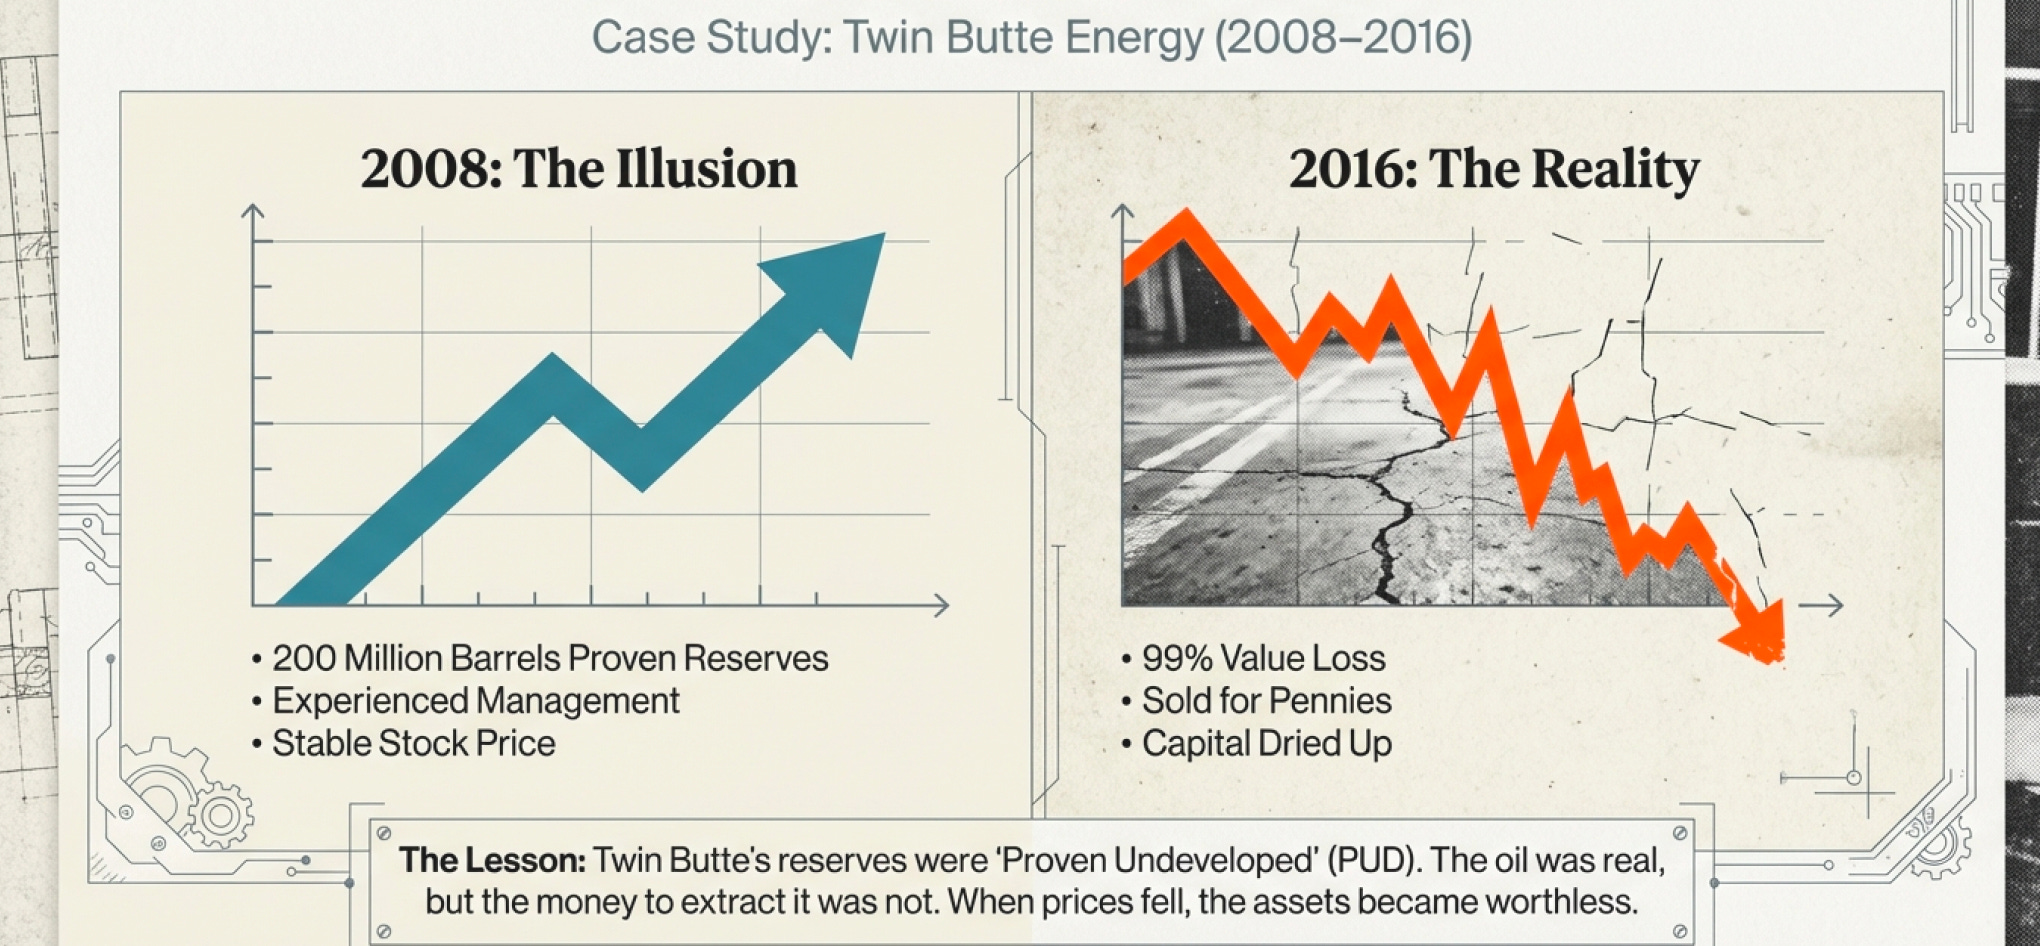
In 2008, a small Canadian oil company called Twin Butte Energy stood before investors with an impressive presentation. They had “proven reserves” of 200 million barrels of oil equivalent. Their stock was trading at reasonable multiples. Their management had decades of experience. Everything looked good on paper.
By 2016, Twin Butte had lost 99% of its value and was being absorbed into a competitor for pennies on the dollar. What happened?
The reserves were real. The oil was actually there, underground, exactly where the geologists said it would be. But here’s the problem: “proven reserves” is like saying you have “money in investments.” It tells you almost nothing about whether you can actually spend it tomorrow, next year, or ever.
Twin Butte’s reserves were overwhelmingly “proven undeveloped” (PUD). This meant they’d need hundreds of millions in capital investment to actually extract that oil. When oil prices collapsed in 2014, suddenly that capital wasn’t available at reasonable terms. The oil might as well have been on Mars.
Meanwhile, a competitor with half the reserves but mostly “proven developed” (PD) reserves—meaning the wells were already drilled and infrastructure in place—sailed through the same crisis. Same storm, different boats, completely different outcomes.
The difference between PD and PUD reserves is worth billions. But most investors never looked past the headline number.
This is the problem with the oil and gas industry: The language is technical, deliberately obscure, and designed by engineers talking to other engineers. But buried in that jargon are fundamental truths about value and risk that separate companies building wealth from companies destroying capital.
Today, we’re going to learn to read that language. Not because it’s fun (though I think it is), but because it’s the difference between understanding what you own and hoping for the best.
How to Lie With Reserve Numbers
Let’s start with a simple question that has a surprisingly complicated answer: How do you know how much oil is underground?
You don’t. Not really. And that’s not being pessimistic—it’s physics.
You can drill a well and know what’s at that exact spot. But oil doesn’t sit in underground lakes. It’s trapped in tiny pores within rock, distributed across potentially hundreds of square miles. You might drill 50 wells across a field and still not know exactly what’s between those wells.
So the industry invented a probability framework. And like most things invented by engineers, it’s both brilliant and confusing.
Here’s how it works:
P90 Reserves (Proven, or 1P): There’s a 90% probability that you’ll recover at least this much oil. These are your conservative estimates—the oil you’re pretty damn sure is there and you can economically extract it.
P50 Reserves (Proven + Probable, or 2P): There’s a 50% probability you’ll recover this much. This is your median case—half the time you’ll get more, half the time you’ll get less.
P10 Reserves (Proven + Probable + Possible, or 3P): There’s only a 10% probability you’ll recover this much. These are your optimistic scenarios—the numbers you share at cocktail parties when you want to sound impressive.

Now here’s where it gets interesting. Imagine a company with 100 million barrels of P90 reserves and 500 million barrels of P10 reserves. The spread between those numbers is massive—400 million barrels of uncertainty.
A narrow spread means you understand the field well. The geology is simple. The uncertainty is low. You’re picking apples from a tree—you can see most of them.
A wide spread means you’re making educated guesses about what’s underground. Maybe the rock properties vary dramatically across the field. Maybe you’ve only drilled a few wells. You’re less picking apples and more guessing how many apples exist in a dense forest.
Until January 2010, the U.S. SEC only allowed companies to report P90 (proven) reserves to investors. That was deliberate conservatism—show us only what you’re 90% confident about. Since 2010, companies can disclose 2P and 3P numbers, but many still use those only for internal planning.
Why? Because once you start reporting P50 and P10 numbers publicly, investors will hold you accountable when you don’t hit them. And you won’t hit P10 numbers 90% of the time—that’s literally what P10 means.
The Two Kinds of Proven - Why “Proven” Doesn’t Mean “Easy” or “You’re Safe”
But even within P90 “proven” reserves, there’s a critical distinction that separates the merely confident from the actually valuable.
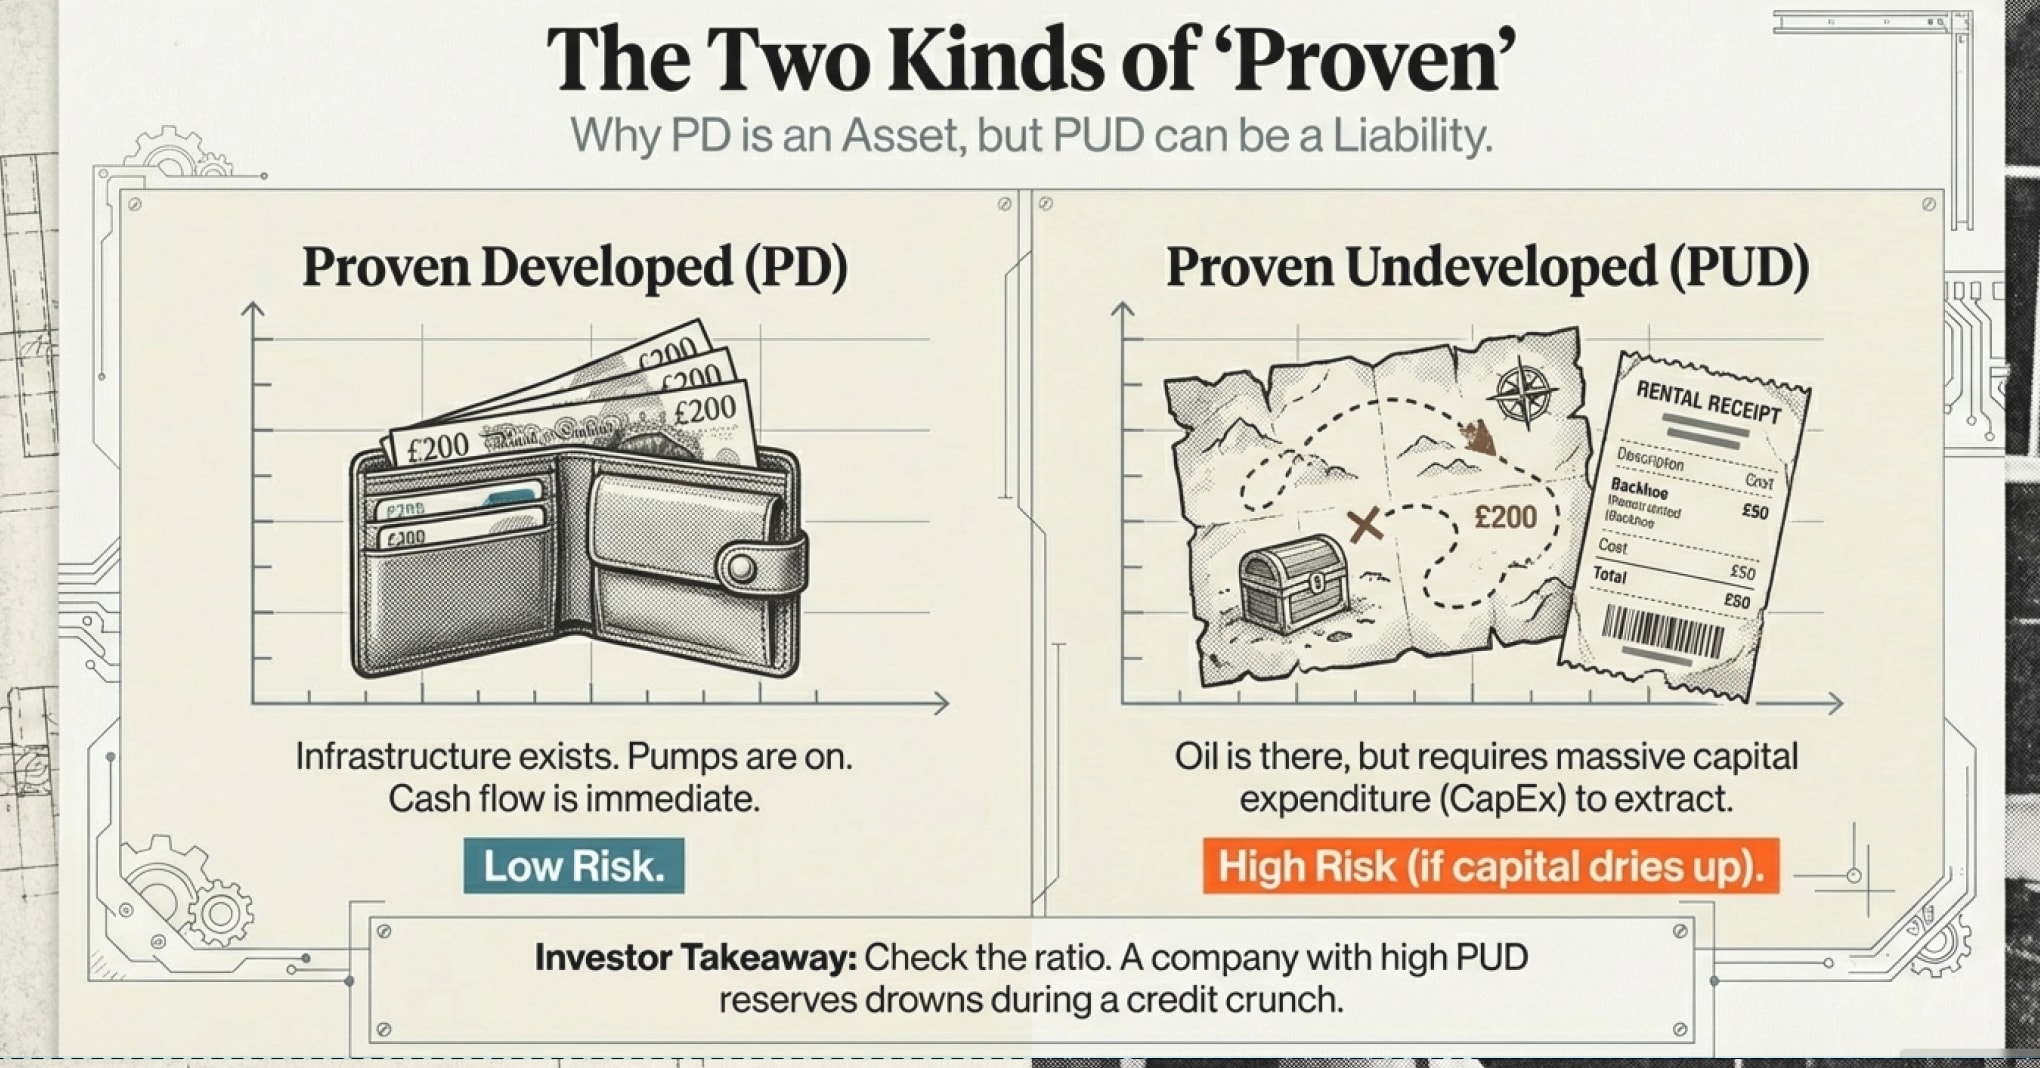
Proven Developed (PD) reserves can be produced with existing wells and facilities. You’ve already spent the capital. The infrastructure is there. Turn on the pumps, and oil flows. These are your sure things—high confidence, low capital requirements.
Proven Undeveloped (PUD) reserves require significant additional investment to produce. You need to drill new wells, build new pipelines, install new processing equipment. The oil is there (90% confidence), but extracting it requires writing big checks first.
Think about what this means for a company’s financial position.
Company A has 200 million barrels of PD reserves. They can produce those barrels starting tomorrow if oil prices are reasonable. Their cash flow is predictable. Their capital requirements are modest—just maintenance and optimization.
Company B has 200 million barrels of PUD reserves. To produce those barrels, they need to spend $2 billion over the next five years on drilling and infrastructure. If oil prices stay strong and capital is cheap, great. If oil prices fall or banks get nervous, they’re stuck. The oil might as well not exist.
This is exactly what killed Twin Butte. They had reserves. They just didn’t have the capital to develop them when it mattered.
Here’s the thought experiment: You’re offered two deals:
Deal A: I’ll give you $200 in your wallet right now.
Deal B: I’ll give you a map showing where $200 is buried, plus a shovel. But you need to rent a backhoe for $50 to dig it up, and the offer expires in six months.
Which do you take?
If you’re confident you’ll have $50 and six months, maybe Deal B is fine. But if cash is tight or time is uncertain, Deal A is obviously better despite being identical in “proven reserves” terms.
This is the PD versus PUD distinction. Same reserves, completely different economic realities.
The Production Profile Mystery - Why “Shale” Changed Everything
Now we need to talk about how oil actually comes out of the ground over time, because this is where things get really interesting—and where conventional wisdom got completely overturned in the last 15 years.
Historically, conventional oil wells followed a predictable pattern. You drill. Production starts relatively modest but steady. It plateaus for a while—maybe years. Then it gradually declines at about 8-10% per year. You could count on production for two decades or more.
This made financial planning straightforward. If a well produced 500 barrels per day in year one, you could reasonably expect 450 barrels per day in year two, 405 in year three. Slow, steady, predictable.
Then the shale revolution happened, and all those assumptions exploded.
Shale wells have what’s called a “hyperbolic decline curve”—a fancy term for “holy hell, look at that production drop.” A typical shale well produces at peak output for maybe 2-3 months. Then production drops 50-70% in the first year alone.
Let me put that in perspective: A conventional well declining at 10% annually would produce 59% of its peak output after five years. A shale well might produce 15-20% of peak output after five years.
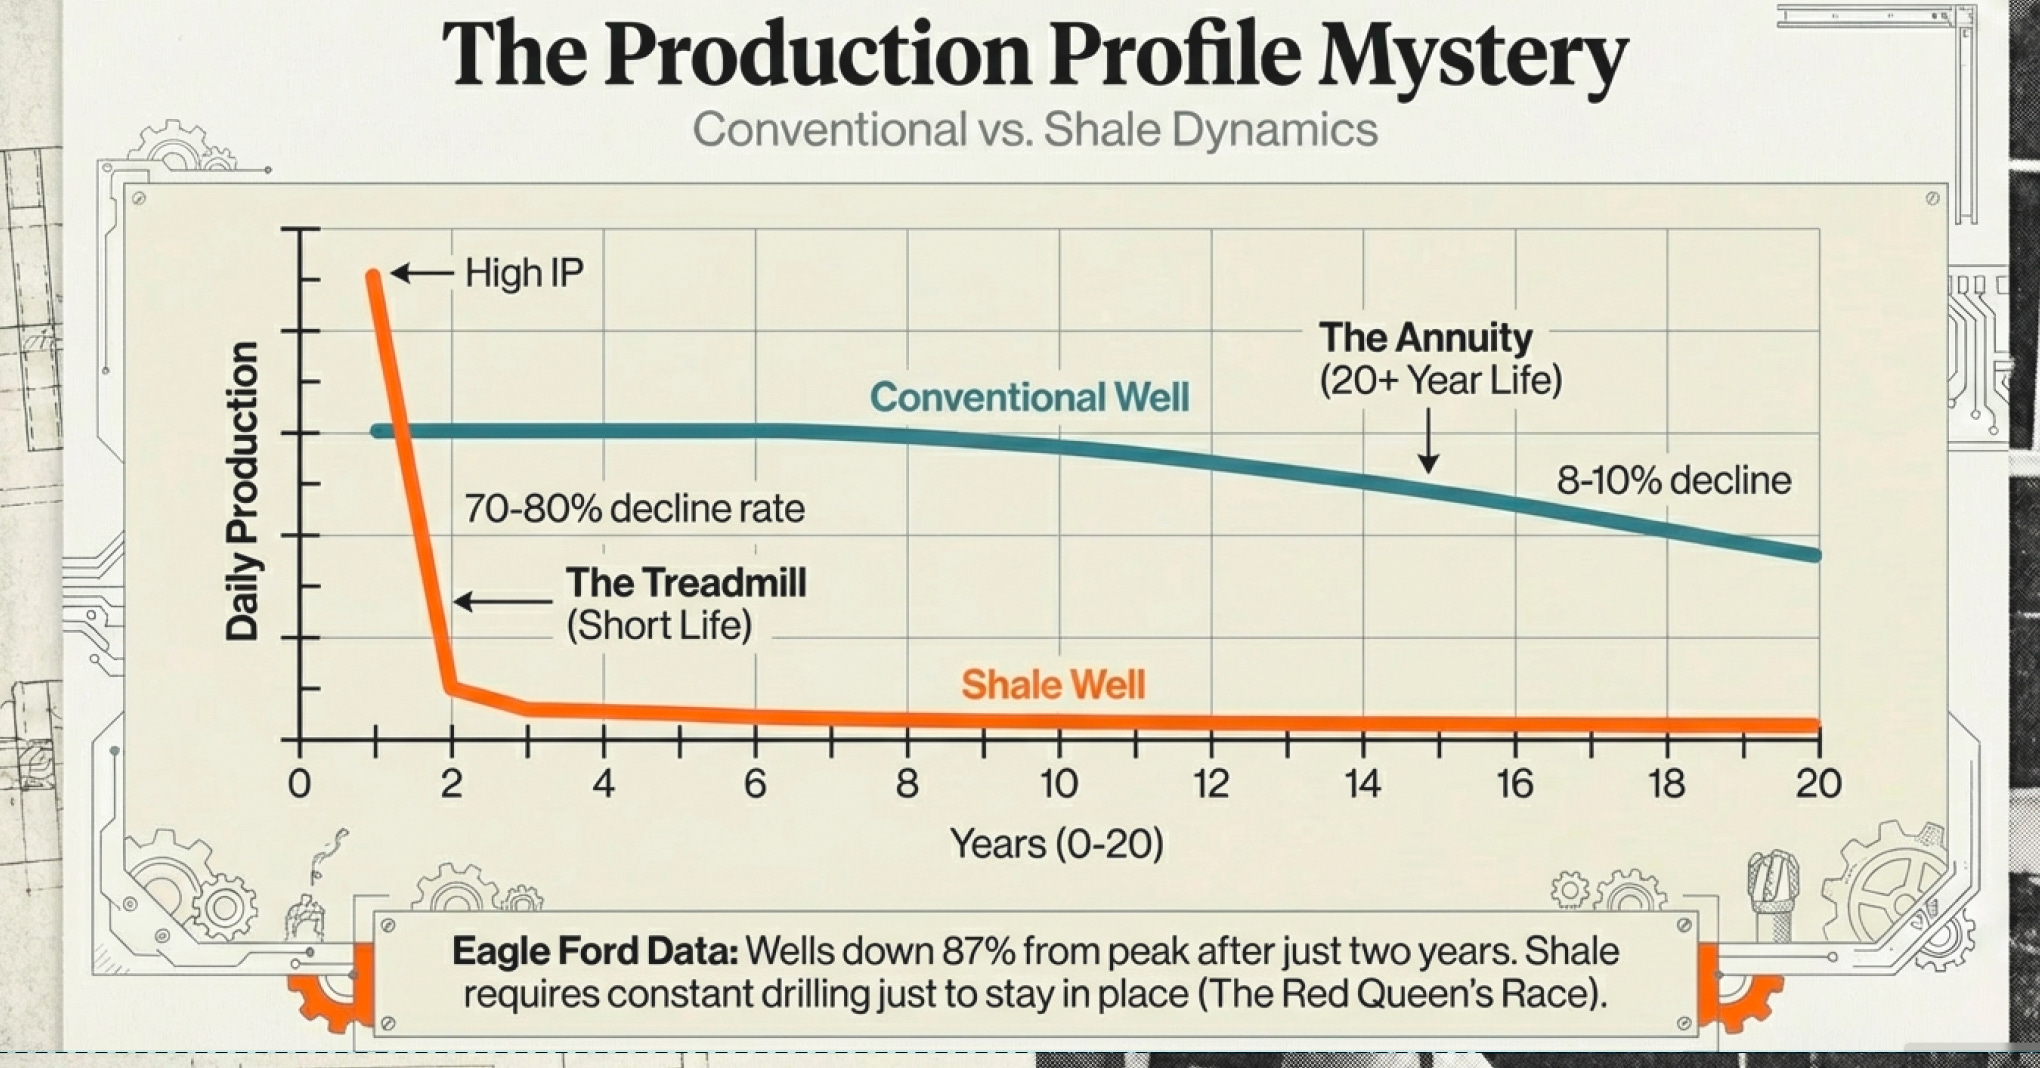
Here’s actual data from Eagle Ford shale wells in Texas: Average initial production was around 500 barrels per day. After one year? Down 75%. After two years? Down 87% from peak.
This isn’t a failure of technology. It’s geology. Shale rock has ultra-low permeability. When you fracture it (fracking), you create artificial cracks that allow oil to flow to the wellbore. But those cracks access only a limited volume of rock—essentially a narrow zone around the well. You drain that zone fast, and then production collapses.
Think about the business implications.
If you’re running a conventional field, you drill wells expecting them to produce meaningful volumes for 15-20 years. You can amortize your capital investment over a long production life. Your planning horizon is measured in decades.
If you’re running a shale field, you’re essentially on a treadmill. Each well produces most of its oil in the first 2-3 years. To maintain production levels, you must constantly drill new wells. Stop drilling for six months, and your production drops dramatically.
This is why the U.S. shale industry has been described as a “hamster wheel” or “Red Queen’s race”—you’re running as fast as you can just to stay in place.
It’s also why shale operators are so sensitive to oil prices. When oil prices drop, they can’t easily cut production from existing wells (those are declining naturally anyway). They can only cut drilling of new wells. But cutting new wells means total production drops quickly, which means revenue drops, which means they drill even fewer new wells. It’s a vicious cycle.
The Decline Curve Detective Work - How to Spot a Lie
Understanding decline curves isn’t just academic. It’s how you tell whether a company is telling you the truth about their economics.
Here’s what you need to watch for:
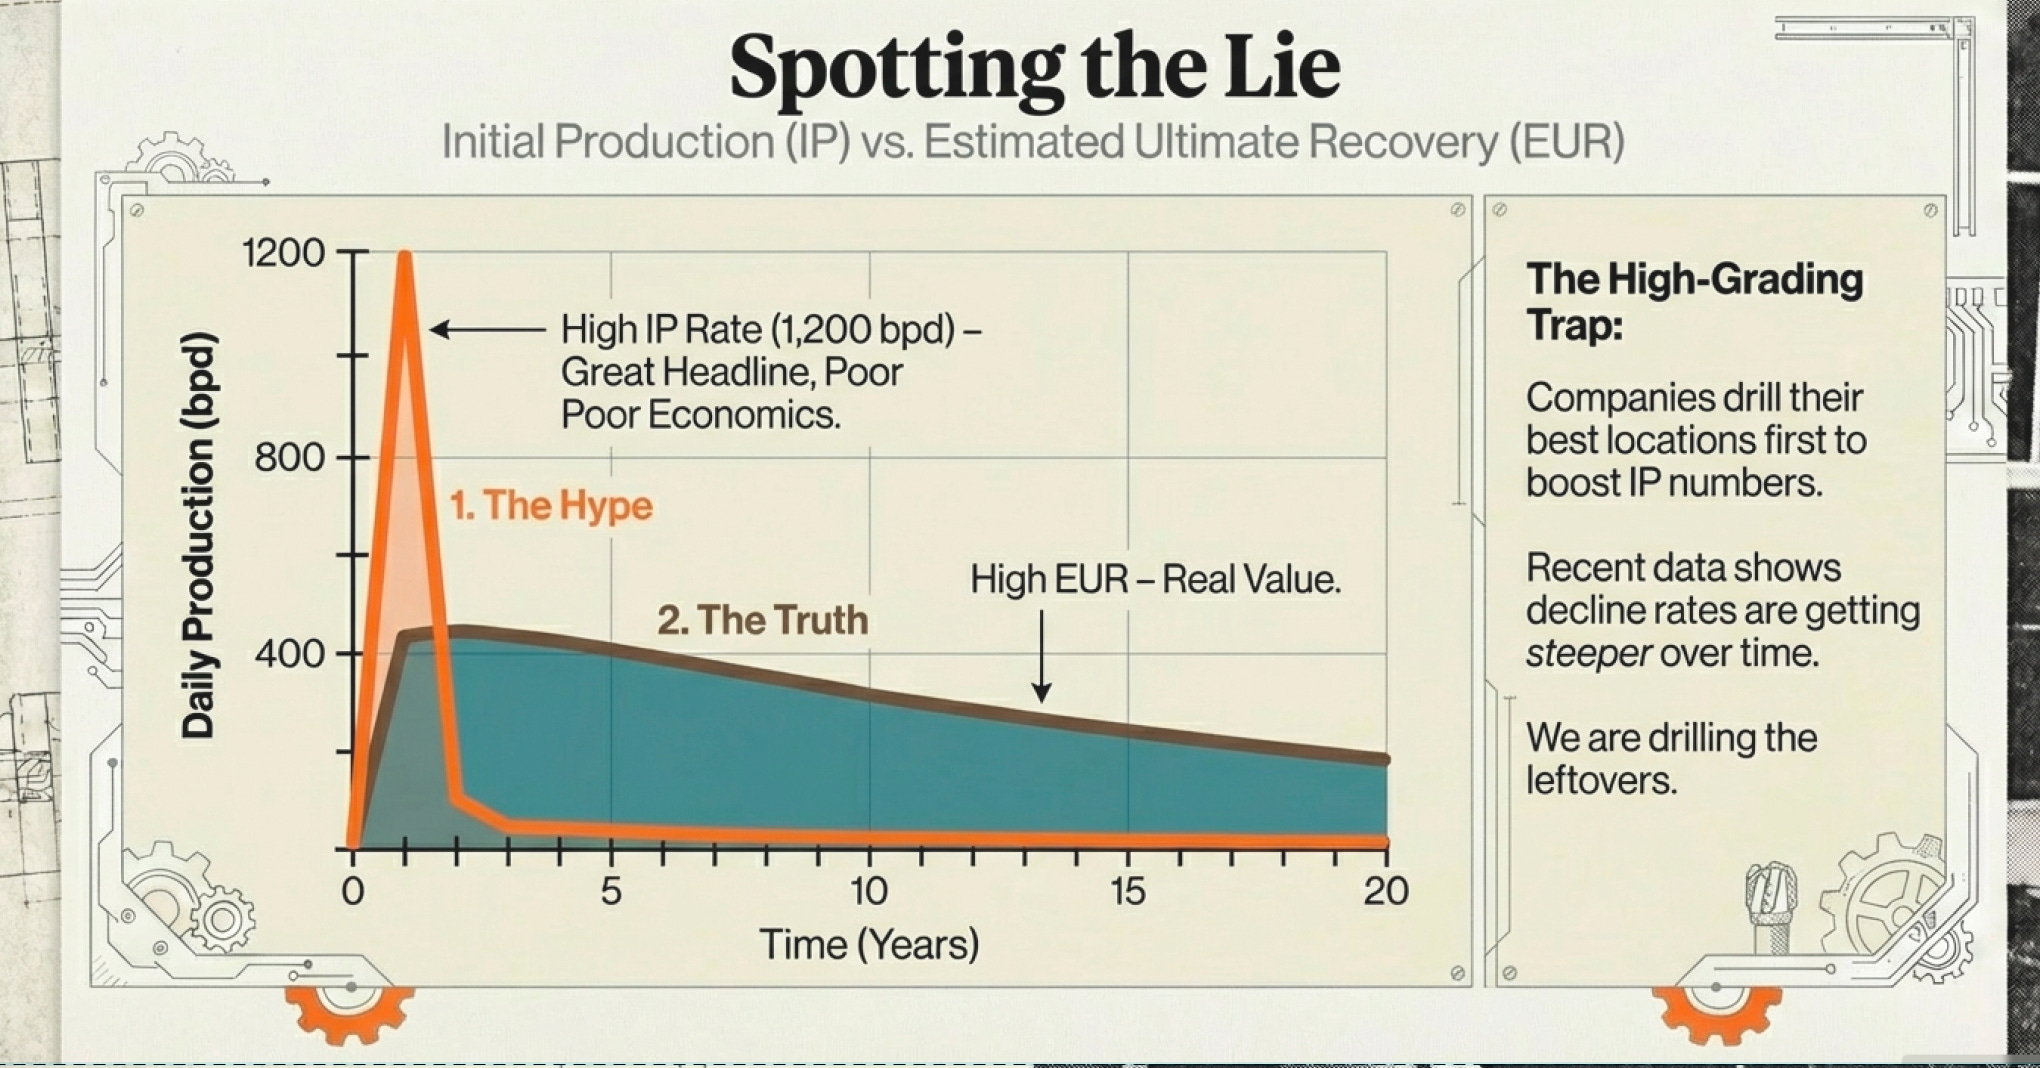
Initial Production (IP) Rate: This is how much a well produces in its first month(s). Companies love to tout high IP rates in press releases. “Our new well in the Permian Basin came online at 1,200 barrels per day!” Sounds impressive. But it means nothing without the decline curve.
A well producing 1,200 bpd initially but declining at 75% in year one will produce far less total oil than a well producing 600 bpd initially but declining at 10% annually. The total oil over the well’s life—the Estimated Ultimate Recovery (EUR)—is what actually matters.
EUR (Estimate Ultimate Recovery) Assumptions: This is where companies can play games. EUR depends on assumptions about decline rates, well life, and economic cutoff (the production level where it costs more to operate the well than the oil is worth).
Company A might assume their shale wells will produce for 30 years. Company B might assume 20 years for identical wells. That will result in a significant difference in EUR despite identical production data. Who’s right? You often can’t tell until years later.
As mentioned, EUR depends on Assumptions (and lots of them, from the company), hence it is less reliable. A better measurement of intrinsic value would instead, come from understanding the reserve type (along with total balance sheet assets) and existing operating costs + total liabilities (since these are factual data that can’t be wrong, unless the company does some number shenanigans - which would also mean you should avoid them). If the oil comes mainly from shale, then the operating costs would tend to last for about 10 years. On the other hand, if it comes from conventional oil fields operating cost can last from approximately 20-40 years.
Type Curves: These are average production profiles for wells in a specific area. Companies use type curves to predict EUR for new wells. But type curves are backward-looking—they’re based on how older wells performed. In shale plays developing rapidly, older wells might have used different completion techniques (less intensive fracking, shorter laterals). Newer wells might perform completely differently.
Recent data shows that despite improvements in completion techniques, decline rates in major shale plays have actually gotten steeper over time—more than 0.5% annually since 2010. Wells drilled in 2023 decline faster than wells drilled in 2020, despite being “better” wells with higher IP rates.
Why? Because the best drilling locations get developed first. After years of intensive drilling, most new wells are near older wells that have already depleted the surrounding reservoir. You’re drilling in the leftovers.
This is called “high-grading” in reverse. Early in a play’s life, companies drill the absolute best locations—high-grade stuff. Those wells perform great. They show those results to investors, who extrapolate that performance across the entire play. Then, gradually, well performance degrades as you drill less optimal locations.
By the time investors realize what’s happening, the company has already spent billions developing locations that will never generate attractive returns.
The Quality Question - Why Chemistry Is Destiny
Let’s switch gears and talk about something that sounds simple but creates massive economic differences: oil quality.
Not all oil is created equal. The price difference between high-quality and low-quality crude can be $20-30 per barrel based purely on its physical properties.
Two factors matter most:
API Gravity (density/viscosity):
Light crude: API > 31.1 degrees
Medium crude: API 22.3-31.1 degrees
Heavy oil: API < 22.3 degrees
Bitumen: API ≤ 10 (so thick it doesn’t flow at room temperature)
Sulfur Content (sweetness):
Sweet crude: < 0.5% sulfur
Sour crude: > 0.5% sulfur
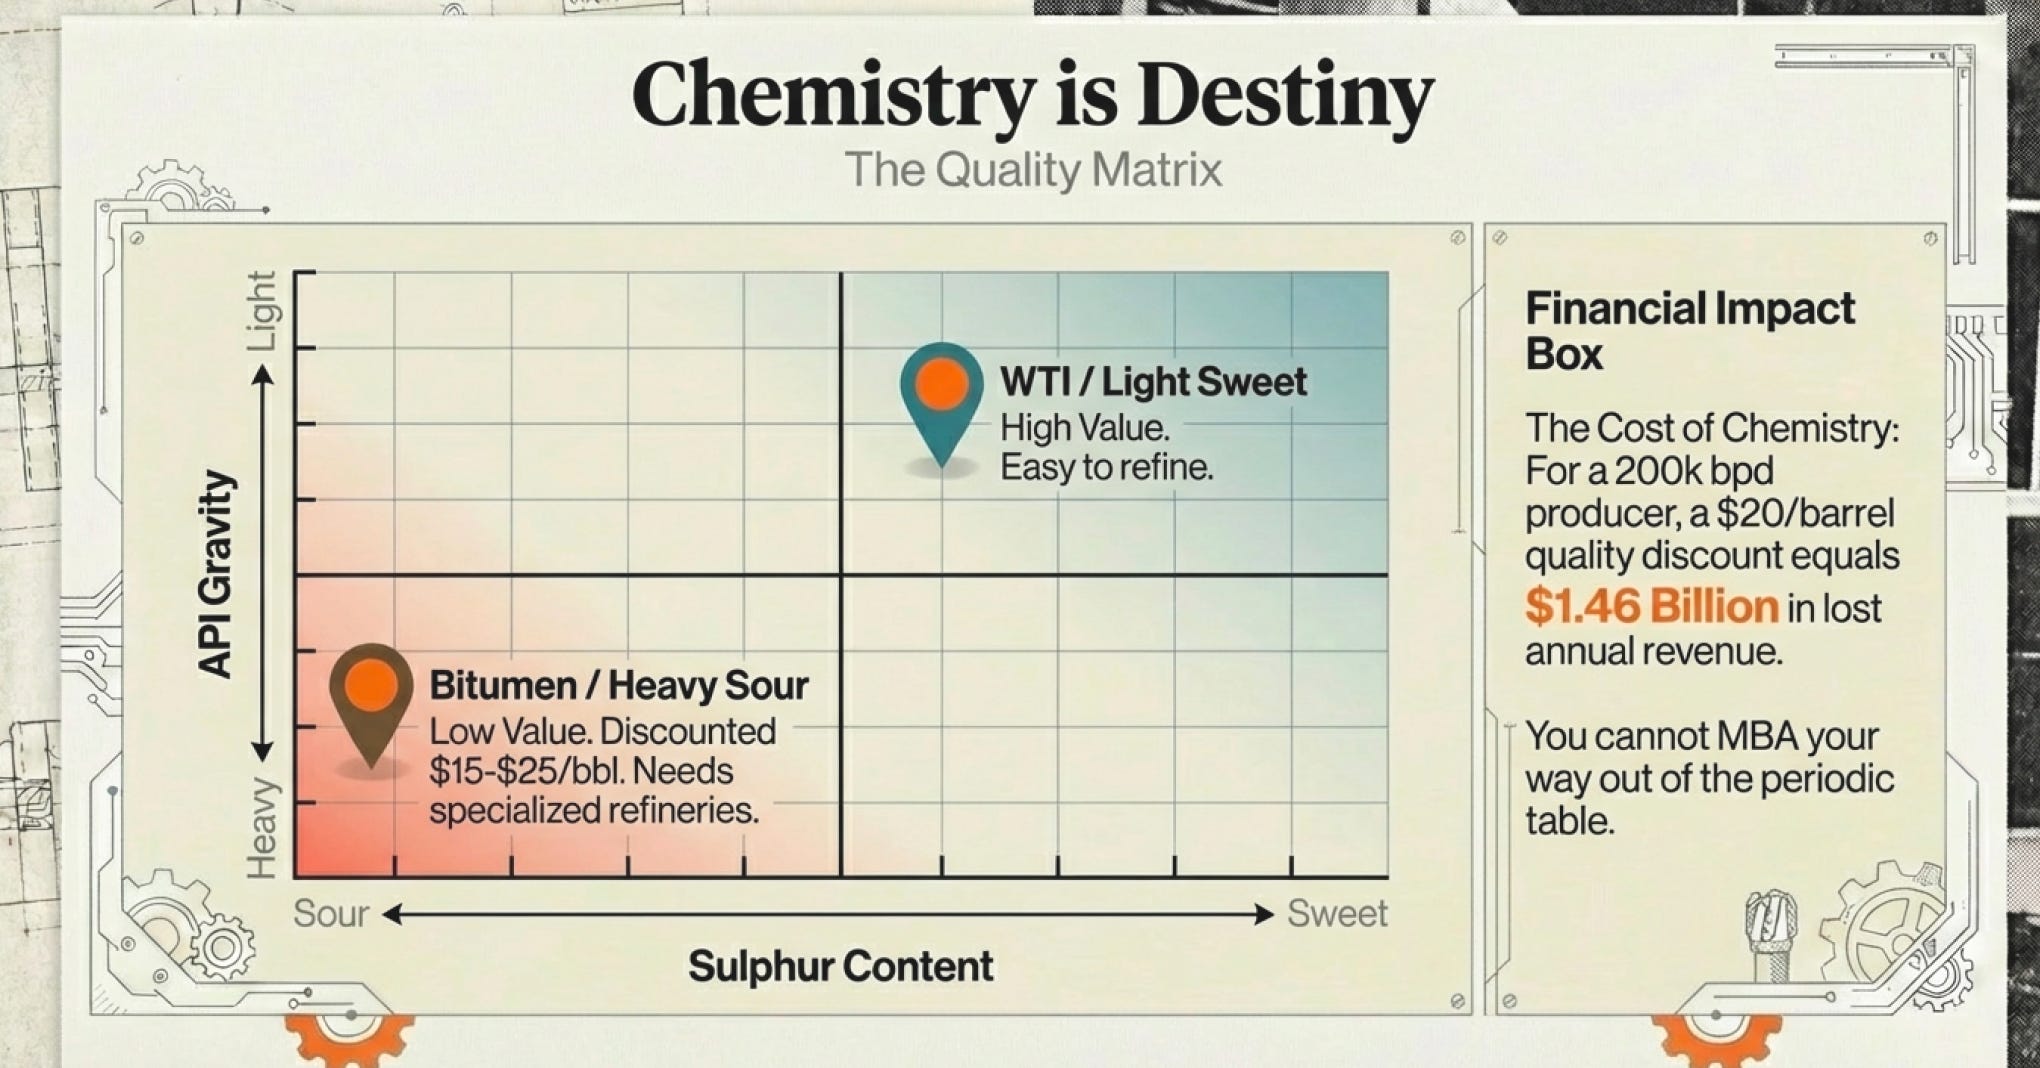
The lighter and sweeter the crude, the easier and cheaper it is to refine into gasoline, diesel, and jet fuel. Therefore, it commands higher prices.
West Texas Intermediate (WTI)—the U.S. benchmark—has an API gravity of 39.6 degrees and sulfur content of 0.24%. It’s light, sweet, and refiners love it.
Canadian oil sands produce bitumen with an API around 8-12 degrees and sulfur content of 3-5%. It’s heavy, sour, and requires specialized refineries. It typically sells at a $15-25/barrel discount to WTI—sometimes more during pipeline capacity crunches.
Think about what this means over millions of barrels.
A company producing 200,000 barrels per day of WTI-quality crude at $75/barrel earns $15 million per day in gross revenue.
A company producing 200,000 bpd of bitumen at a $20 discount earns $11 million per day.
That’s $4 million per day less—$1.46 billion per year—purely because of what they’re producing, not how well they’re producing it. The difference between these companies isn’t management quality or operational efficiency. It’s geology and chemistry.
You cannot MBA your way out of the periodic table.
The Storage Problem - The Peculiarity of Natural Gas
We need to take a brief detour into natural gas because it reveals something important about how physical properties shape business economics.
Oil is relatively easy to store and transport. You can put it in tanks, load it on ships, and send it anywhere in the world. This makes oil a global commodity with a global price (mostly).
Natural gas is a pain in the ass.
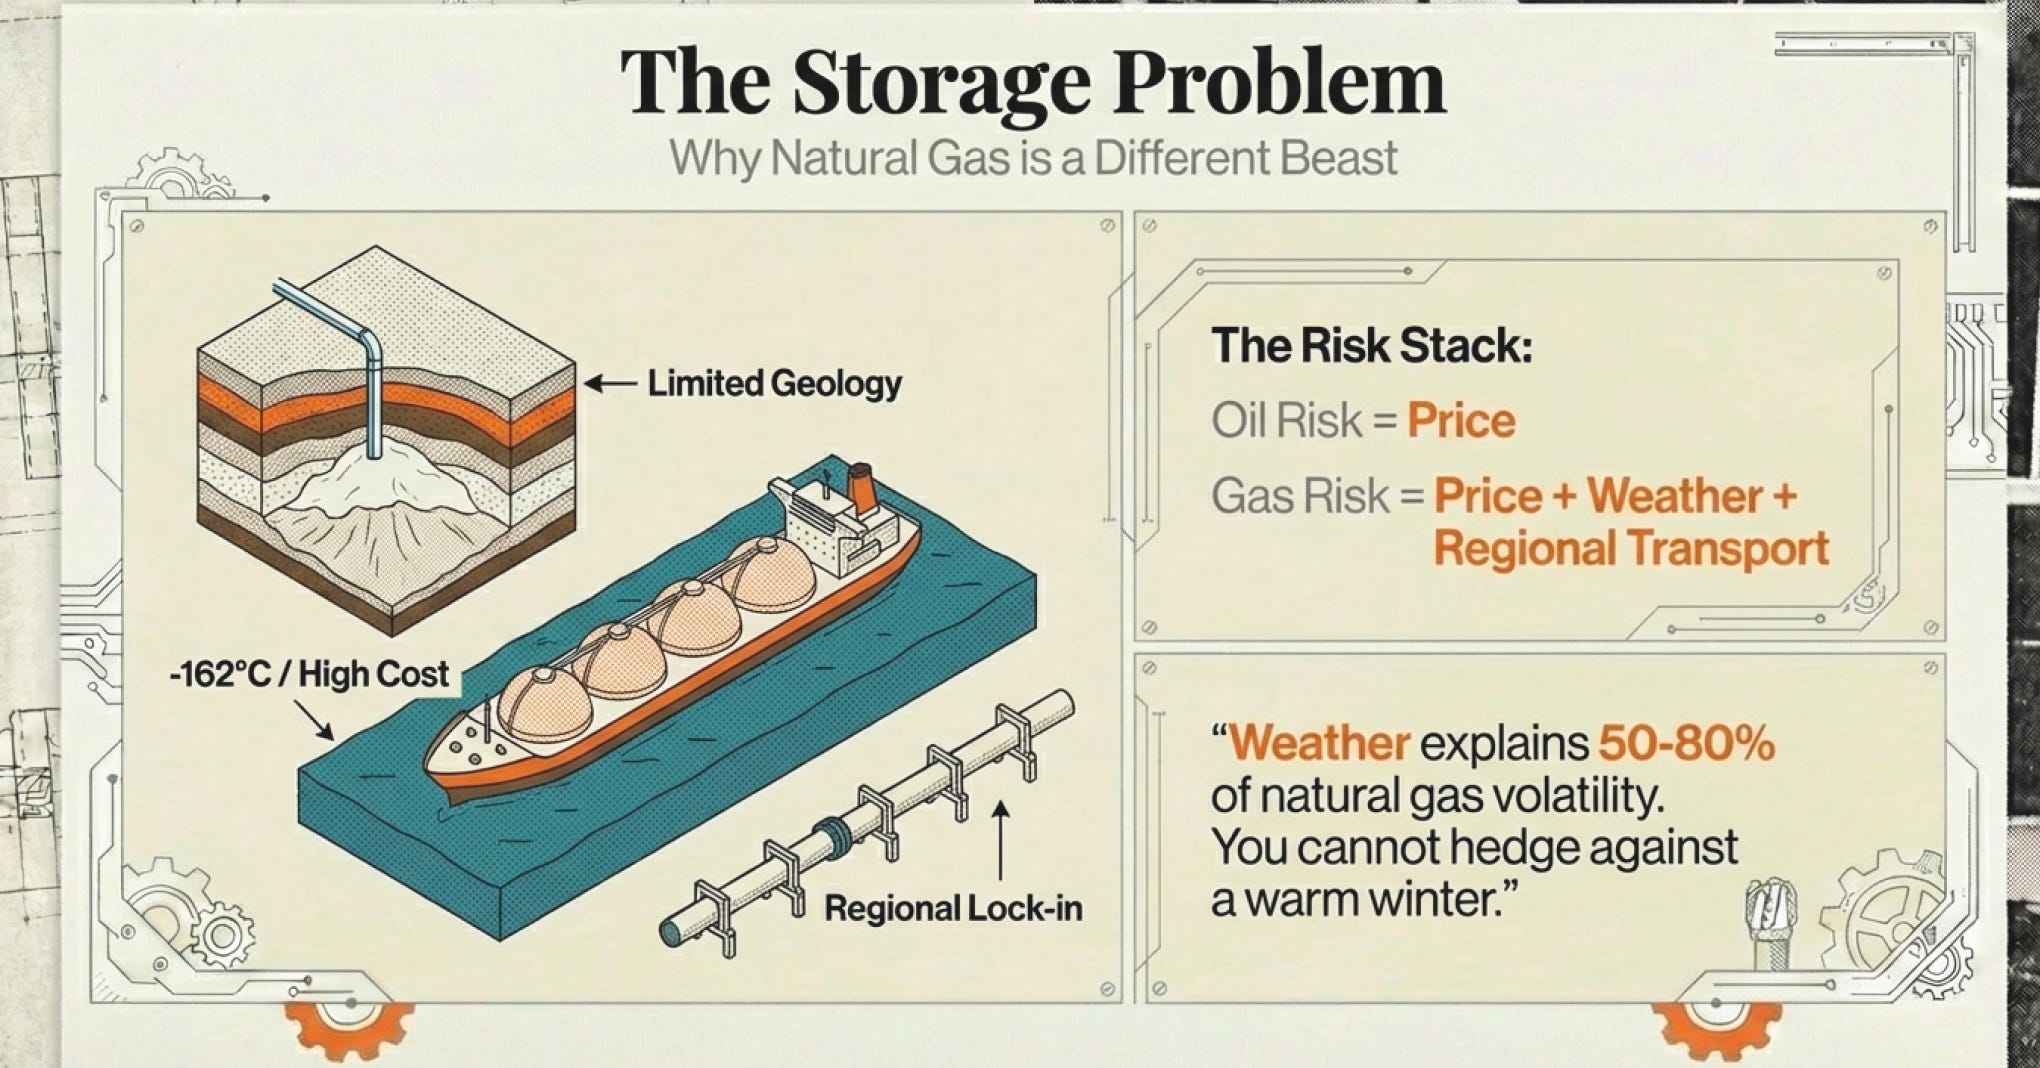
You can’t store it easily. It’s a gas (obviously), so it takes up a lot of space. Your options are:
Store it underground in depleted reservoirs or salt caverns. This works, but capacity is limited and you need the right geology.
Cool it to -162°C and compress it into Liquefied Natural Gas (LNG). This works for shipping long distances, but requires expensive facilities at both ends.
Pipe it, but pipelines are fixed routes with fixed capacity.
This creates bizarre market dynamics.
In winter, when people are heating homes and demand spikes, natural gas prices can jump from $3/MMBtu to $7/MMBtu in a matter of weeks. In summer, mild weather can crater prices because there’s nowhere to put the excess gas and limited ability to arbitrage it to other markets.
The Weekly Natural Gas Storage Report (published every Thursday by the EIA) is therefore crucially important. It tells you how much gas is in storage relative to historical averages. If storage levels are near empty heading into winter, prices will almost certainly spike. If storage is overflowing in summer, prices will stay depressed.
Weather explains 50-80% of natural gas price volatility. You cannot predict the weather six months out. Therefore, you cannot reliably predict natural gas prices six months out.
This is why Brian Hunter at Amaranth Advisors lost $6 billion in one week in 2006 on natural gas trades. He bet on weather patterns. The weather didn’t cooperate. The positions were too large to exit. Game over.
For companies, this means natural gas is far harder to value than oil. A natural gas company with fantastic reserves and low production costs can still face terrible economics if they’re producing during a warm winter when prices collapse and they can’t store or ship the gas elsewhere.
Oil companies face commodity price risk. Natural gas companies face commodity price risk plus weather risk plus more regional supply-demand mismatches. It’s a more complicated business, which is why many investors prefer oil-focused companies.
The Economic Cutoff - When Oil Stops Being Worth the Trouble
Here’s a question that sounds simple but determines whether reserves are real or fantasy: At what price does it stop making sense to produce oil from a well?
This is called the “economic cutoff” or “abandonment conditions,” and it’s crucial for calculating reserve life and EUR.
Think about a well producing 50 barrels per day. At $75/barrel, that’s $3,750 per day in gross revenue. But you have costs:
Electricity to run pumps
Labor to monitor and maintain the well
Water disposal or treatment
Lease operating expenses
Transportation to get the oil to market
Taxes and royalties
Maybe these total $2,000 per day. You’re netting $1,750/day—$638,750 per year. Great.
Now production declines to 20 barrels per day. Your revenue is now $1,500/day, but your costs haven’t dropped proportionally. Maybe they’re $1,400/day. You’re barely making money.
At 10 barrels per day, you’re losing money. Time to shut in the well.
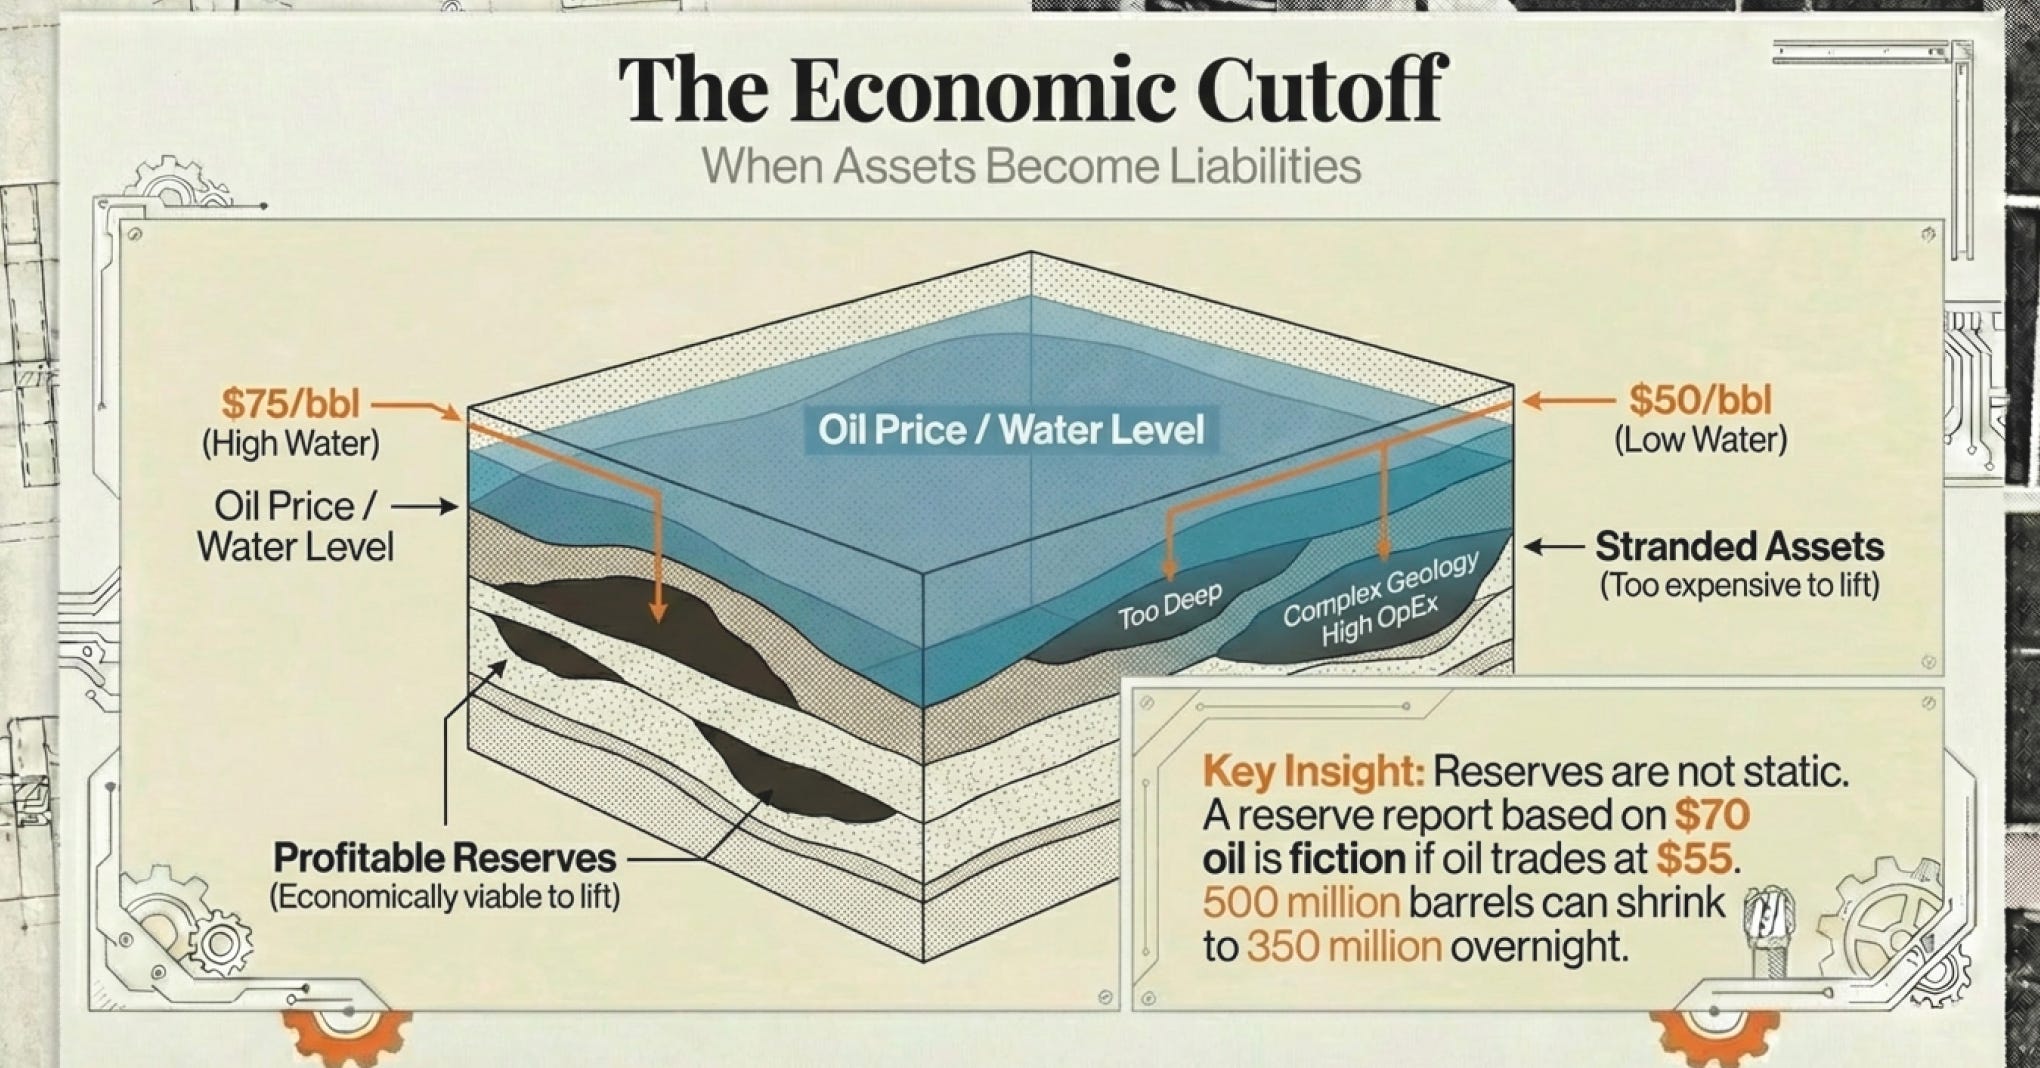
What makes this tricky is that the economic cutoff changes with oil prices. At $100/barrel oil, it might make sense to operate a well producing 8 bpd (barrels per day). At $50/barrel, maybe the cutoff is 25 bpd (high operating leverage due to fixed cost).
So a company’s reserve report might show 500 million barrels of EUR assuming $70/barrel oil. But if oil prices average $55/barrel, their actual reserves might be 350 million barrels. This is why reserve reports always specify the price assumptions used. And why those assumptions matter as much as the geology.
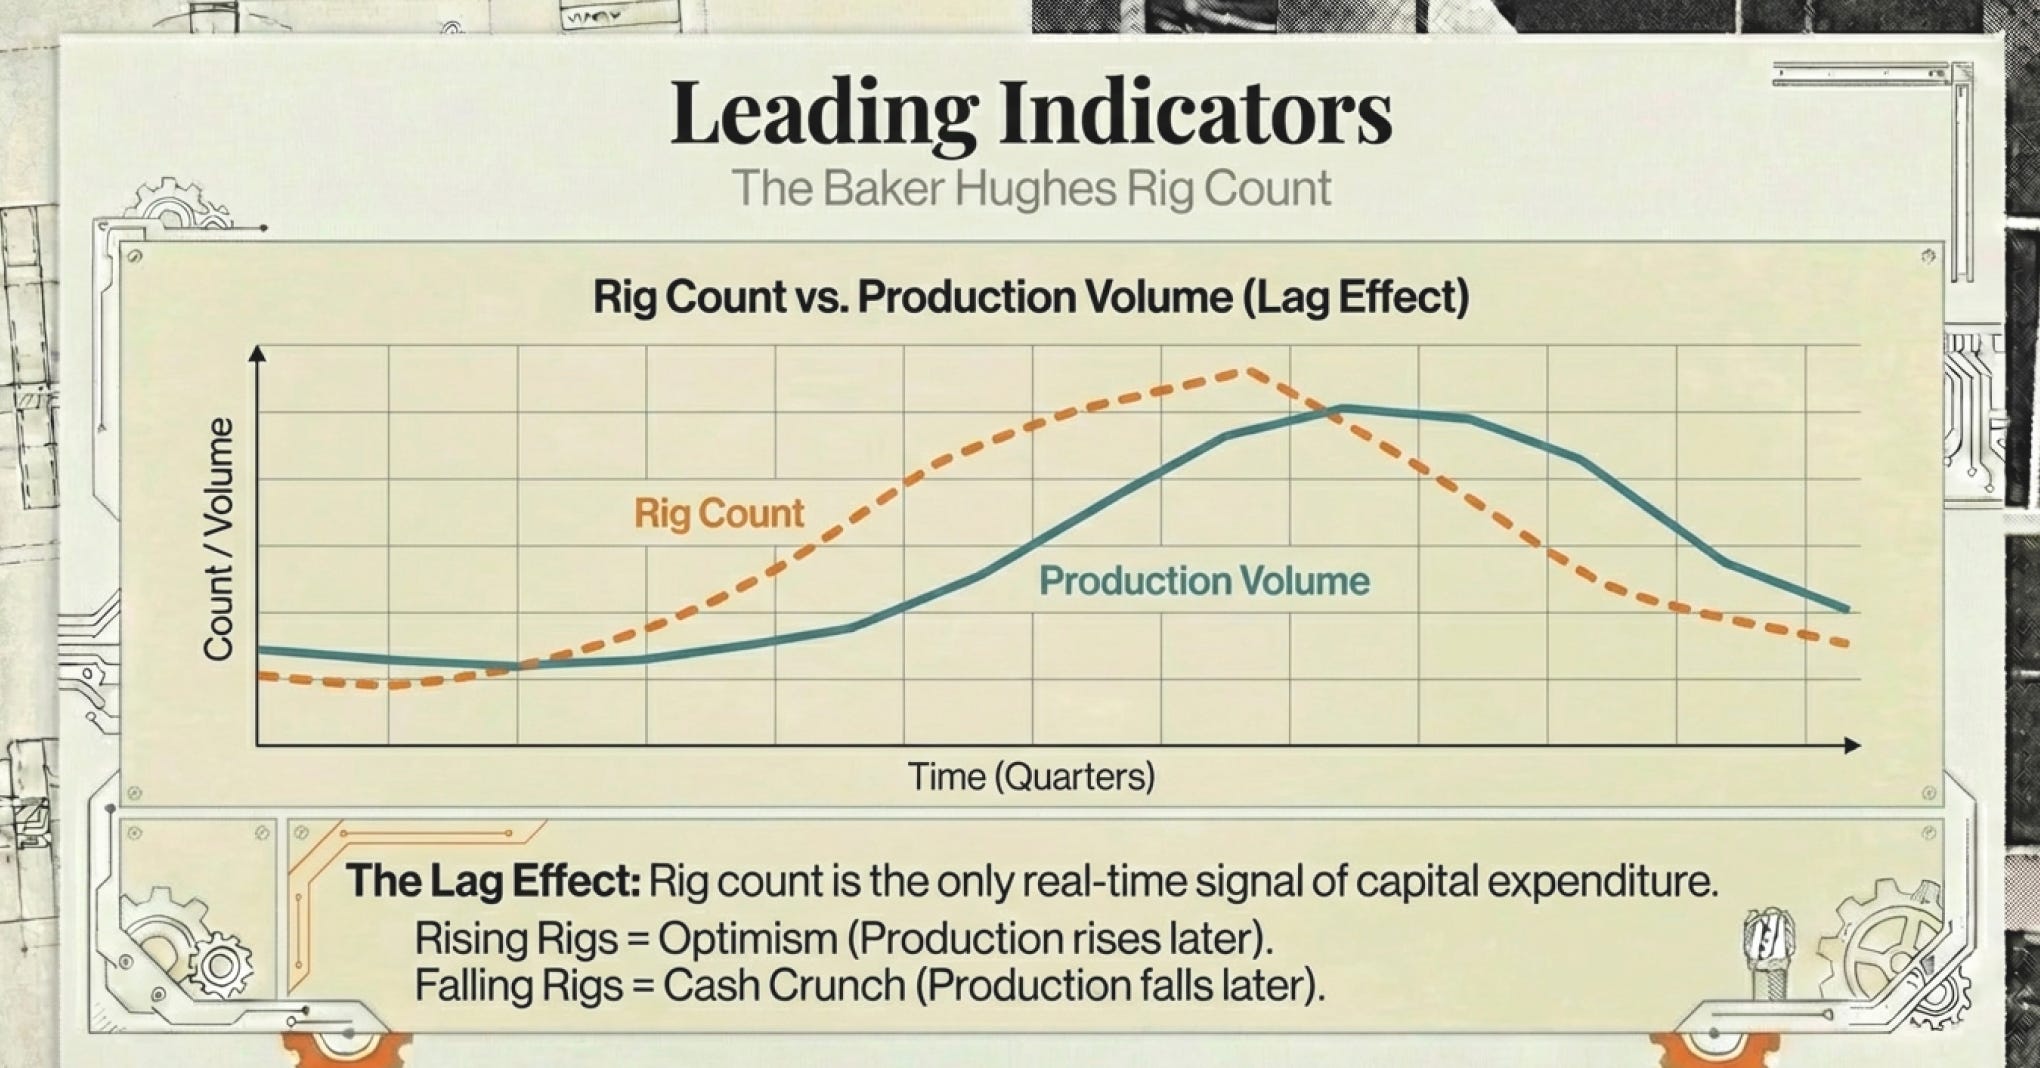
The Baker Hughes Rig Count - Baker Hughes Rig Count
One of the most watched indicators in the industry is the Baker Hughes rig count, published weekly. It tells you how many drilling rigs are actively working in different regions.
Why does this matter?
Because it’s a real-time signal of what operators actually believe about future prices.
Drilling a well costs millions of dollars. Companies only drill if they believe the well will generate attractive returns. If the rig count is rising, it means companies are collectively optimistic about future prices. If it’s falling, they’re pessimistic or facing capital constraints.
During the 2014-2016 oil price collapse, the U.S. rig count fell from about 1,600 rigs to 400 rigs. Companies slashed drilling budgets overnight. Production kept rising for a while (existing wells kept producing), but eventually the lack of new wells caused production to plateau and then decline.
When oil prices recovered in 2017-2018, the rig count climbed back toward 900 rigs. Production soared again.
In 2020, when oil briefly went negative due to COVID demand collapse, the rig count plunged below 300. Companies couldn’t cut fast enough.
The rig count is what companies are actually doing with their capital, not what they’re saying in press releases. It’s one of the few leading indicators that’s published weekly and reflects actual capital deployment decisions.
About 80% of all drilling activity in the lower 48 states and Western Canada is tied to natural gas drilling, so movements in the gas rig count signal gas market expectations.
If you see rig counts rising consistently at increasing day rates (the cost to contract a rig), you know operators believe prices are heading higher long-term. If rig counts are falling despite stable prices, operators are either facing capital constraints or expect future weakness.
The Crack Spread Enigma - Why Refiners Are Terrible Businesses
Let’s talk briefly about refining, because it illustrates an important principle: proximity to the commodity doesn’t guarantee good economics.
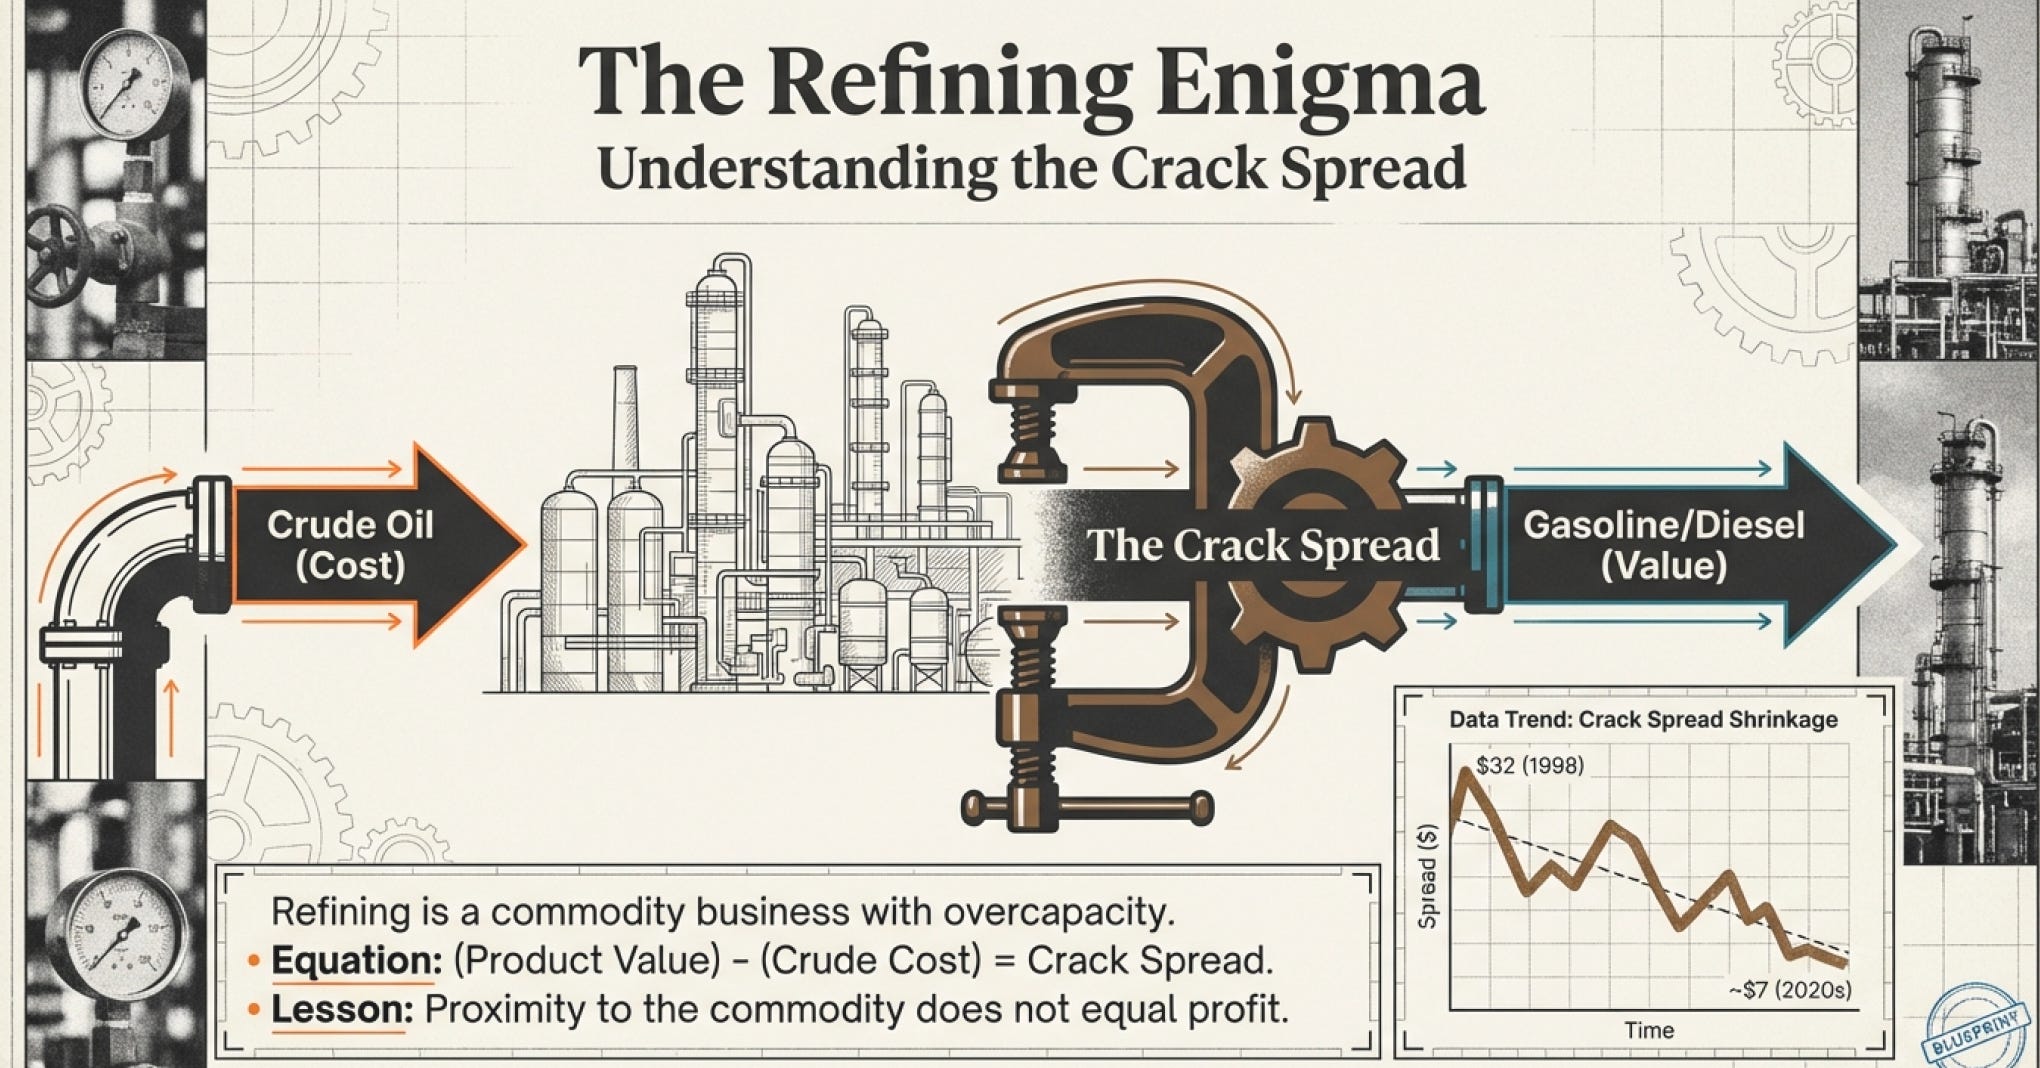
Refiners take crude oil and “crack” it into useful products like gasoline, diesel, and jet fuel. The profit margin they earn is called the “crack spread”—the difference between the cost of crude oil input and the value of refined product output.
In December 1998, crack spreads hit $31.98 per barrel. By the 2020s, they’d collapsed to around $7 per barrel—a decline of more than 70%.
Why? Overcapacity. Too many refineries chasing too much oil. Refining has become a commodity business with commodity returns—low margins, high capital intensity, and little pricing power.
This is why integrated oil companies (those owning both production and refining) often underperform pure-play producers. The refining business acts as a drag on returns, even when the production side is performing well.
The crack spread tells you whether refiners can make money at current oil prices. When crack spreads are strong (wide), refiners print money. When they’re narrow, refiners struggle to cover costs.
Crack spreads tend to be seasonal—higher in summer when gasoline demand peaks (driving season), lower in winter. But the long-term trend has been declining margins as global refining capacity has grown faster than demand.
For investors, this means being very careful about “integrated” companies unless they’re truly exceptional. Often, you’re better off owning a pure-play producer and letting someone else deal with the terrible economics of refining.
The Measurement Maze
One final piece of industry vocabulary that matters: units of measurement.
Oil is measured in barrels. One barrel = 42 U.S. gallons = 159 liters = approximately 0.136 metric tonnes.
Natural gas is measured in cubic feet or cubic meters. One thousand cubic feet (mcf) is common. One million cubic feet (mmcf) is common for larger volumes. One billion cubic feet (bcf) for even larger.
But here’s the problem: Companies often report oil and gas together. How do you add barrels of oil to cubic feet of gas?
The industry invented the “barrel of oil equivalent” (BOE). One BOE equals:
One barrel of oil, OR
Approximately 6,000 cubic feet of natural gas (based on energy content)
So a company might say they produce “100,000 BOE per day,” which could be 100,000 barrels of oil, or 600 million cubic feet of gas per day, or some combination.
Here’s why this matters: Oil and gas do not trade at equivalent prices on an energy basis.
If one barrel of oil contains the same energy as 6,000 cubic feet of gas, and oil trades at $75/barrel, then gas should trade at $12.50 per thousand cubic feet (mcf) for energy equivalence.
In reality, natural gas often trades around $3/mcf. That means gas is trading at a 70-75% discount to oil on an energy-equivalent basis.
So when a company reports “100,000 BOE/d” of production, you need to know the mix. If it’s 80% gas, that’s very different than if it’s 80% oil.
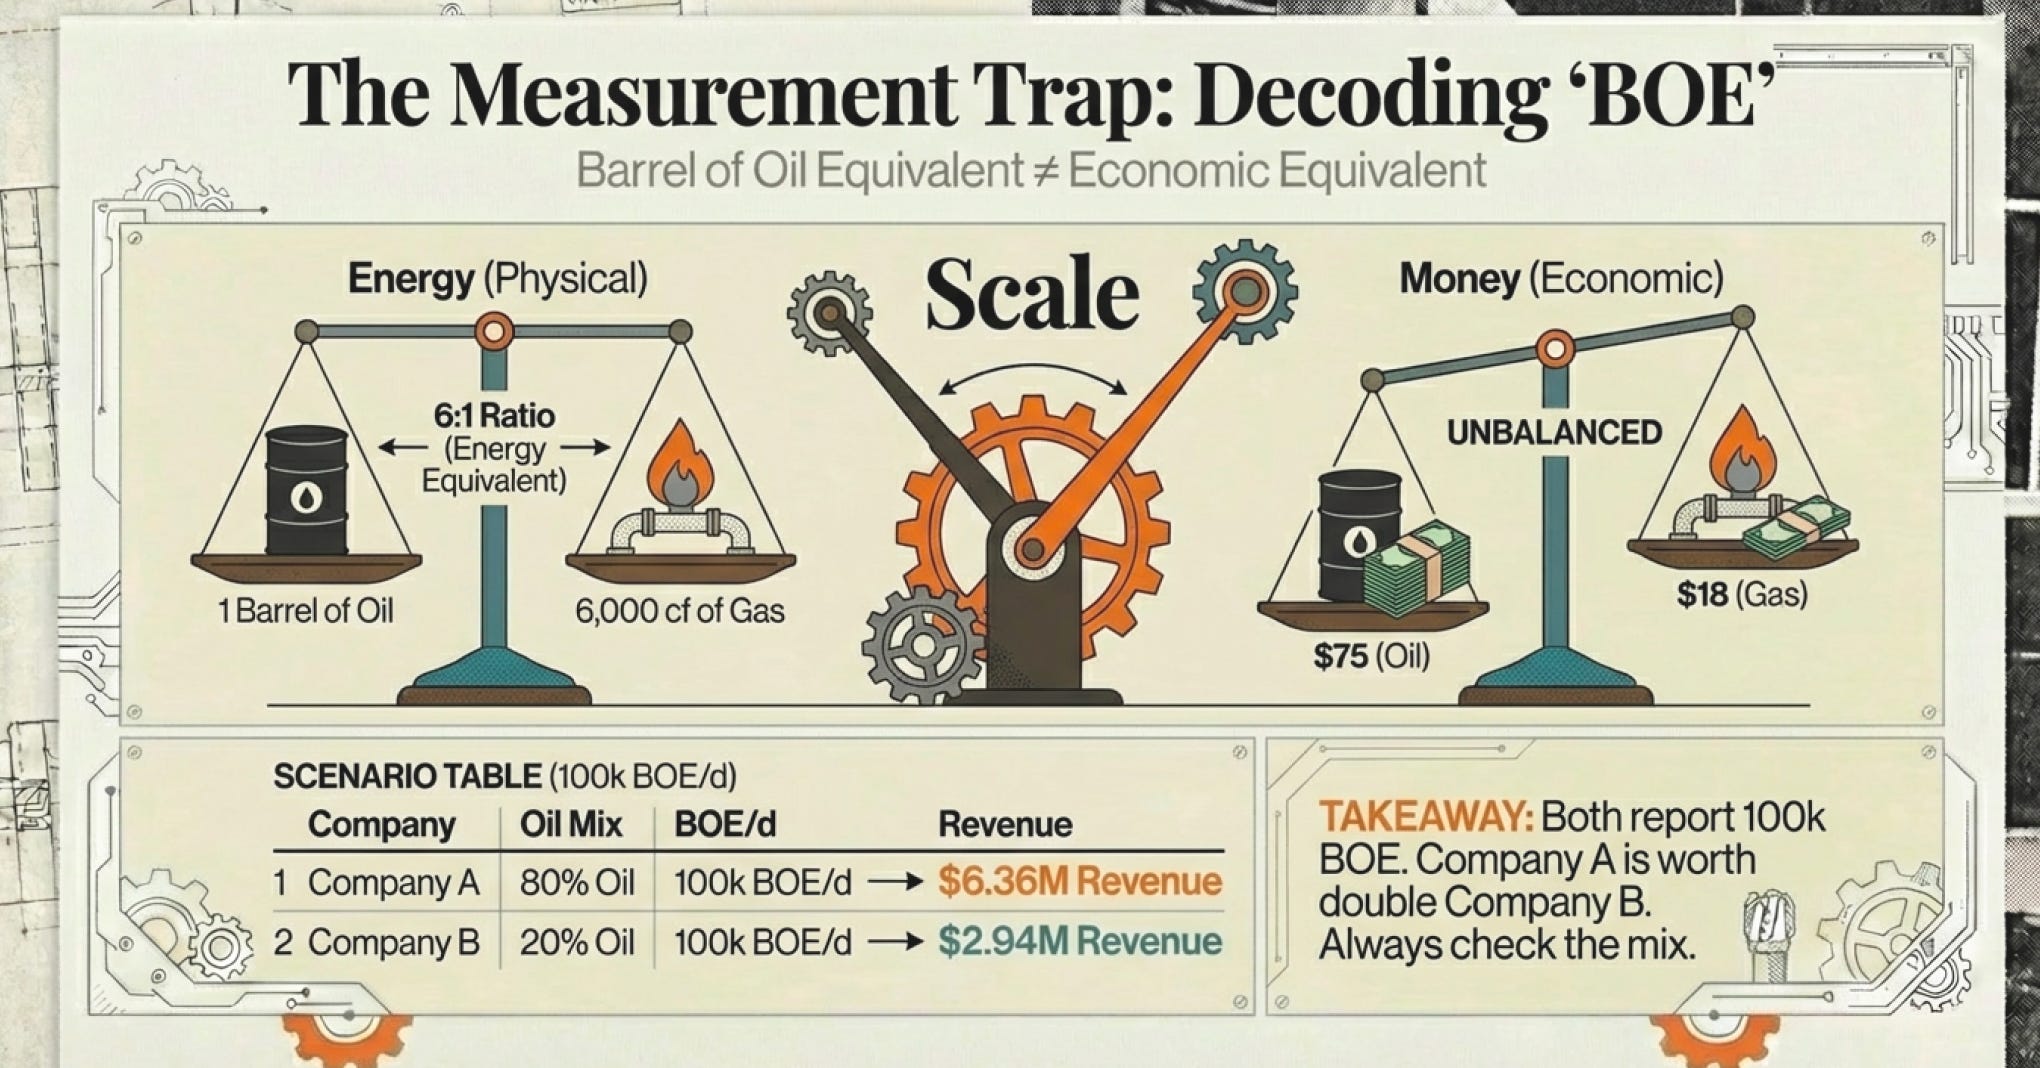
Two companies with identical “100,000 BOE/d” production might have completely different revenue:
Company A (80% oil): 80,000 barrels oil at $75 + 120 million cubic feet gas at $3/mcf = $6.36 million per day
Company B (20% oil): 20,000 barrels oil at $75 + 480 million cubic feet gas at $3/mcf = $2.94 million per day
Company A makes more than twice as much revenue despite identical BOE production.
This is why you always need to dig into the production mix. BOE is useful for comparing companies, but only if you understand what’s underneath the number.
Why Any of This Actually Matters
So we’ve spent several thousand words talking about reserve classifications, decline curves, oil quality, and units of measurement. If you’re still reading, you might be wondering: why does any of this matter?
Here’s why.
Every company in the oil and gas industry is essentially a bundle of reserves at various stages of development, producing according to different decline profiles, with varying quality, requiring different levels of capital investment to maintain production.
When analysts talk about a company having “great reserves,” they might mean:
Large P10 reserves (possible but speculative)
Large P90 reserves (proven and reliable)
Mostly PD reserves (can produce tomorrow with minimal capital)
Mostly PUD reserves (need billions in investment first)
High-quality light sweet crude (commands premium prices)
Low-quality heavy sour crude (sells at steep discounts)
Conventional wells (steady 8-10% annual decline)
Shale wells (50%+ first-year decline requiring constant drilling)
These are completely different businesses wearing the same industry label.
Two companies with identical “500 million barrels of proven reserves” might have completely different risk profiles, capital requirements, and future cash flows.
Understanding the fundamentals—the technical details of how oil and gas are measured, classified, and extracted—is how you see through the marketing and understand what you actually own.
This is what separates investors who understand the business from those who are guessing based on press releases and commodity price predictions.
The Question That Changes Everything
But here’s where we need to zoom out. All of these fundamentals—reserve quality, decline curves, production profiles—exist within a broader context. They don’t operate in a vacuum.
A company with the best reserves in the world can still be a terrible investment if they operate in countries where governments might nationalize their assets. A company with mediocre reserves can generate great returns if they operate in a region with low political risk and access to premium markets.
A pure-play producer with high-graded reserves might outperform an integrated giant with more total reserves but terrible refining margins.
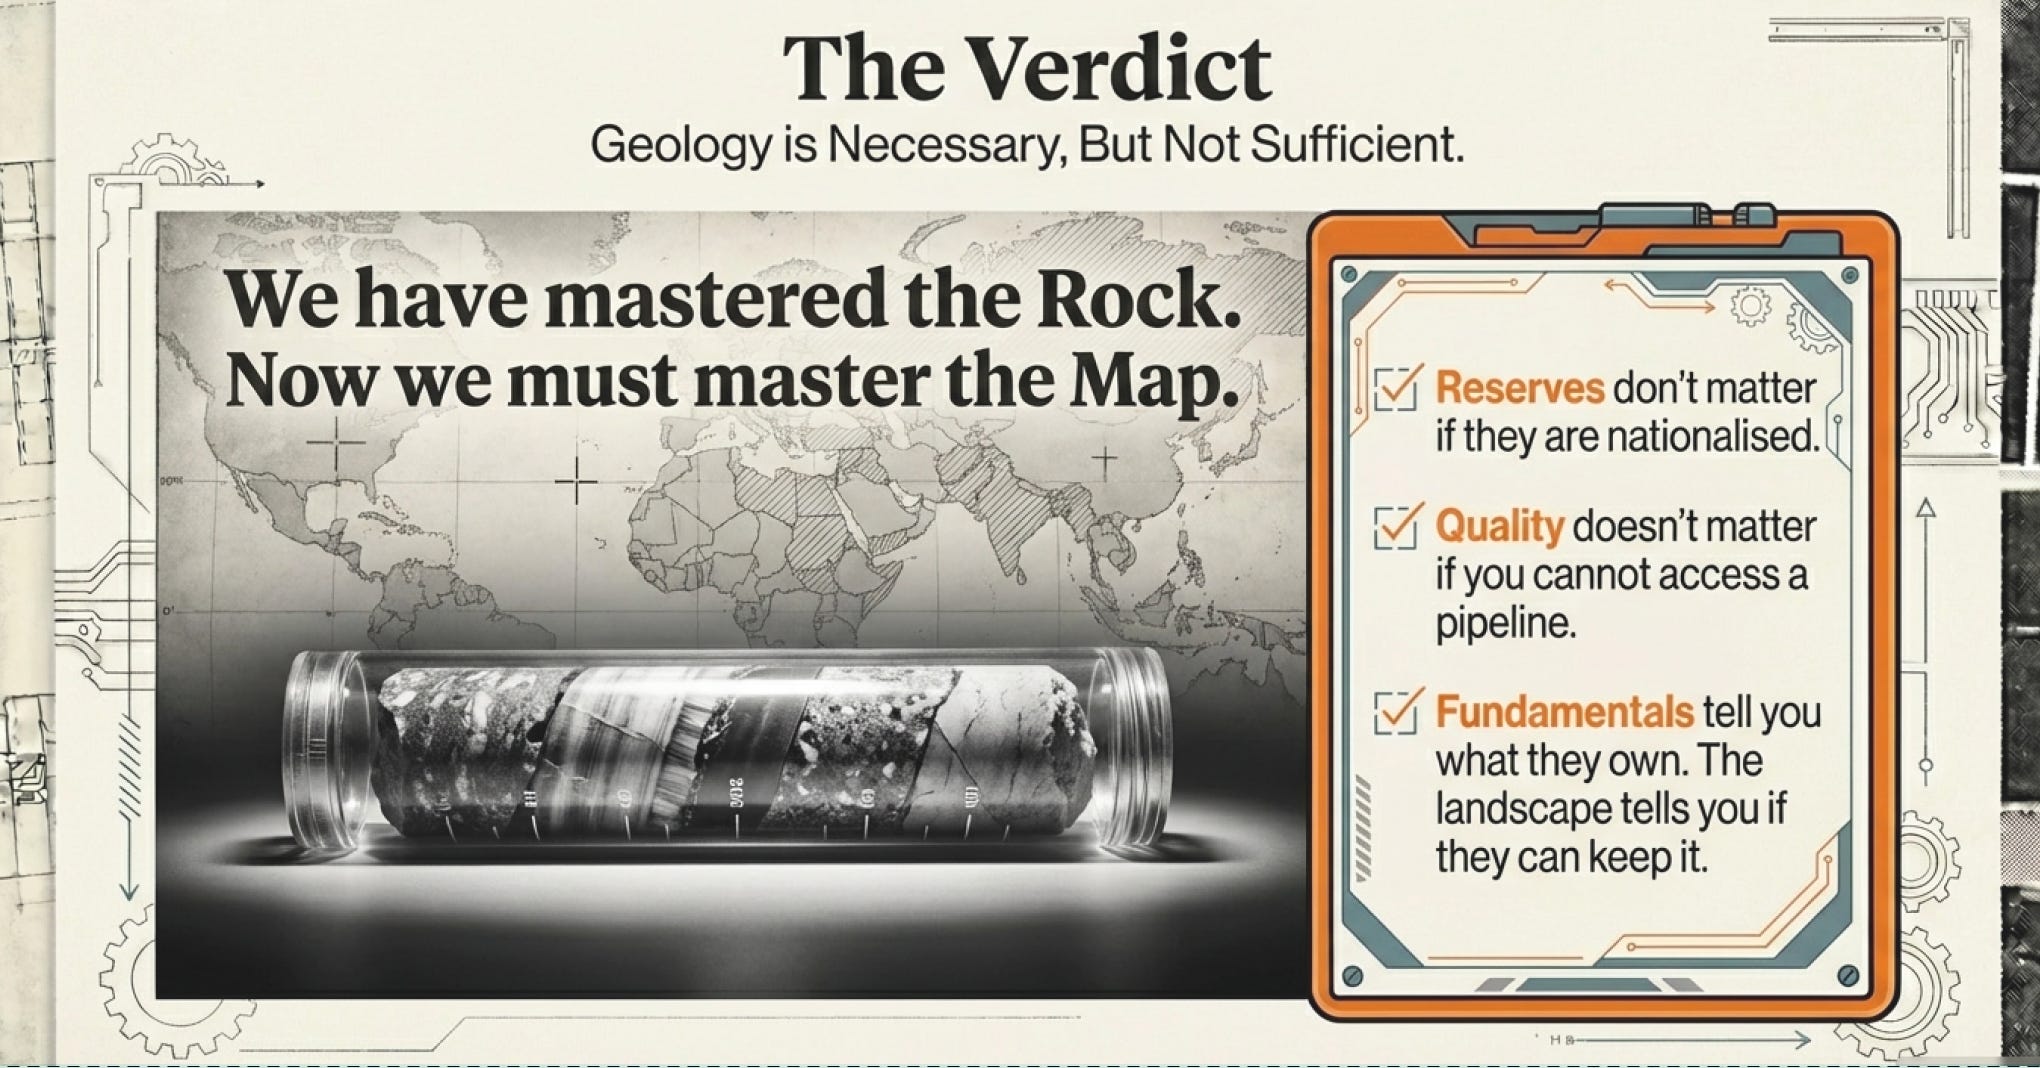
Geography matters. Ownership structure matters. Access to markets matters. Political stability matters. The competitive landscape matters.
You can know everything about a company’s reserves and still not understand whether they’re positioned to win or lose in the brutal competition for global energy markets.
This is where the fundamentals meet business reality. It’s where the technical details transform into strategic advantages or fatal weaknesses.
And that’s exactly what we’ll explore next: How do all these technical fundamentals translate into competitive positions? Who has the structural advantages? Why do some companies with “worse” fundamentals actually generate better returns? What separates winners from losers when everyone is digging up the same commodity?
The fundamentals tell you what’s underground. The competitive landscape tells you who’s positioned to profit from it.
Next up: Business & Competitive Landscape—where we’ll see how geology, geography, and geopolitics collide to create winners and losers in the global fossil fuel industry.
Click here for Business & Competitive Landscape:
References
Reuters — Receiver appointed for Canada’s Twin Butte Energy (2016)
https://www.reuters.com/article/business/receiver-appointed-for-canadas-twin-butte-energy-idUSKCN1182PH/FTI Consulting — Twin Butte Energy Ltd. (receiver and asset sale information)
https://cfcanada.fticonsulting.com/twinbutte/BOE Report — Private company enters agreement to purchase Twin Butte Energy assets
https://boereport.com/2017/01/12/private-company-enters-into-agreement-to-purchase-twin-butte-energy/MarketScreener — West Lake Energy completes acquisition of Twin Butte assets
https://www.marketscreener.com/quote/stock/TWIN-BUTTE-ENERGY-LTD-120793574/news/Yahoo Finance — Twin Butte Energy debenture holders reject proposed takeover
https://ca.finance.yahoo.com/news/twin-butte-energy-debenture-holders-reject-proposed-takeover-220255169.htmlU.S. Securities and Exchange Commission — Modernization of Oil and Gas Reporting (2008–2010 rule change)
https://www.sec.gov/rules/final/2008/33-8995.pdfSEC — Oil and Gas Disclosure Guidance
https://www.sec.gov/spotlight/oilandgas.shtmlSociety of Petroleum Engineers (SPE) — Petroleum Resources Management System (PRMS)
https://www.spe.org/en/industry/petroleum-resources-management-system/SPE — PRMS Guidelines (definitions of proved, probable, possible; PD vs PUD)
https://www.spe.org/industry/docs/PRMS_Guidelines_Nov2011.pdfInvestopedia — Proven Reserves
https://www.investopedia.com/terms/p/proven-reserves.aspInvestopedia — Proved Undeveloped Reserves (PUD)
https://www.investopedia.com/terms/p/proved-undeveloped-reserves.aspInvestopedia — API Gravity
https://www.investopedia.com/terms/a/api-gravity.aspInvestopedia — Sweet vs. Sour Crude Oil
https://www.investopedia.com/terms/s/sourcrude.aspInvestopedia — Barrel of Oil Equivalent (BOE)
https://www.investopedia.com/terms/b/barrelofoilequivalent.aspInvestopedia — Crack Spread
https://www.investopedia.com/terms/c/crackspread.aspWikipedia — Oil and gas reserves and resource quantification (P90 / P50 / P10)
https://en.wikipedia.org/wiki/Oil_and_gas_reserves_and_resource_quantificationWikipedia — Amaranth Advisors natural gas collapse
https://en.wikipedia.org/wiki/Amaranth_AdvisorsIHS Markit — Oil & gas reserves evaluation and probabilistic reserves
https://ihsmarkit.com/products/oil-gas-reserves-evaluation.htmlOil & Gas Journal — Probabilistic reserves definitions and practices
https://www.ogj.com/home/article/17229922/probabilistic-reserves-definitions-practices-need-further-refinementU.S. Energy Information Administration (EIA) — Oil and gas reserves definitions
https://www.eia.gov/tools/glossary/index.php?id=oil_reservesEIA — Drilling Productivity Report (shale productivity and decline behavior)
https://www.eia.gov/petroleum/drilling/EIA — Shale well decline rate trends
https://www.eia.gov/todayinenergy/detail.php?id=38672EIA — Crude oil pricing, quality differentials, and benchmarks
https://www.eia.gov/energyexplained/oil-and-petroleum-products/prices-and-outlooks.phpEIA — Natural gas explained: storage, LNG, and transport constraints
https://www.eia.gov/energyexplained/natural-gas/EIA — Weekly Natural Gas Storage Report
https://www.eia.gov/naturalgas/storage/Baker Hughes — Rig Count Data https://rigcount.bakerhughes.com/
Railroad Commission of Texas — Eagle Ford shale production data
https://www.rrc.texas.gov/oil-gas/major-oil-and-gas-formations/eagle-ford-shale/Journal of Petroleum Technology (SPE) — Decline curve analysis fundamentals
https://jpt.spe.org/twa/understanding-decline-curve-analysisU.S. Geological Survey — Unconventional oil and gas assessment methodology
https://www.usgs.gov/programs/energy-resources-programCanadian Energy Regulator — Oil sands bitumen quality and pricing discounts
https://www.cer-rec.gc.ca/en/data-analysis/energy-commodities/crude-oil-petroleum-products/market-snapshots/CME Group — Understanding the crack spread
https://www.cmegroup.com/education/articles-and-reports/understanding-the-crack-spread.html